
Appearance
BI-Dashboard User Guide
URL: https://bi-dashboard.item.com
BI-Dashboard is a data visualization and reporting platform built on Redash. It enables you to query data from multiple sources, create charts and dashboards, and share insights across teams.
Getting Started
Login
Navigate to https://bi-dashboard.item.com and sign in using your BI System account credentials (the same email and password provided in your account creation email).
Queries
A Query is the foundation of BI-Dashboard. Each query connects to a data source and returns a result set that can be visualized or used in a dashboard.
Creating a Query
- Click + New Query in the top navigation.
- Select a Data Source from the dropdown (e.g., a Redshift database).
- Write your SQL in the query editor.
- Click Execute (or press
Ctrl + Enter) to run the query. - Click Save and give the query a name.
Scheduling a Query
Queries can be set to refresh automatically:
- Open a saved query.
- Click the Refresh Schedule option at the bottom of the page.
- Choose a refresh interval (e.g., every hour, daily).
Adding Parameters
Use syntax in your SQL to create dynamic filters. When the query runs, an input box will appear for users to fill in the parameter value.
Example:
sql
SELECT * FROM orders WHERE status = '{{ order_status }}'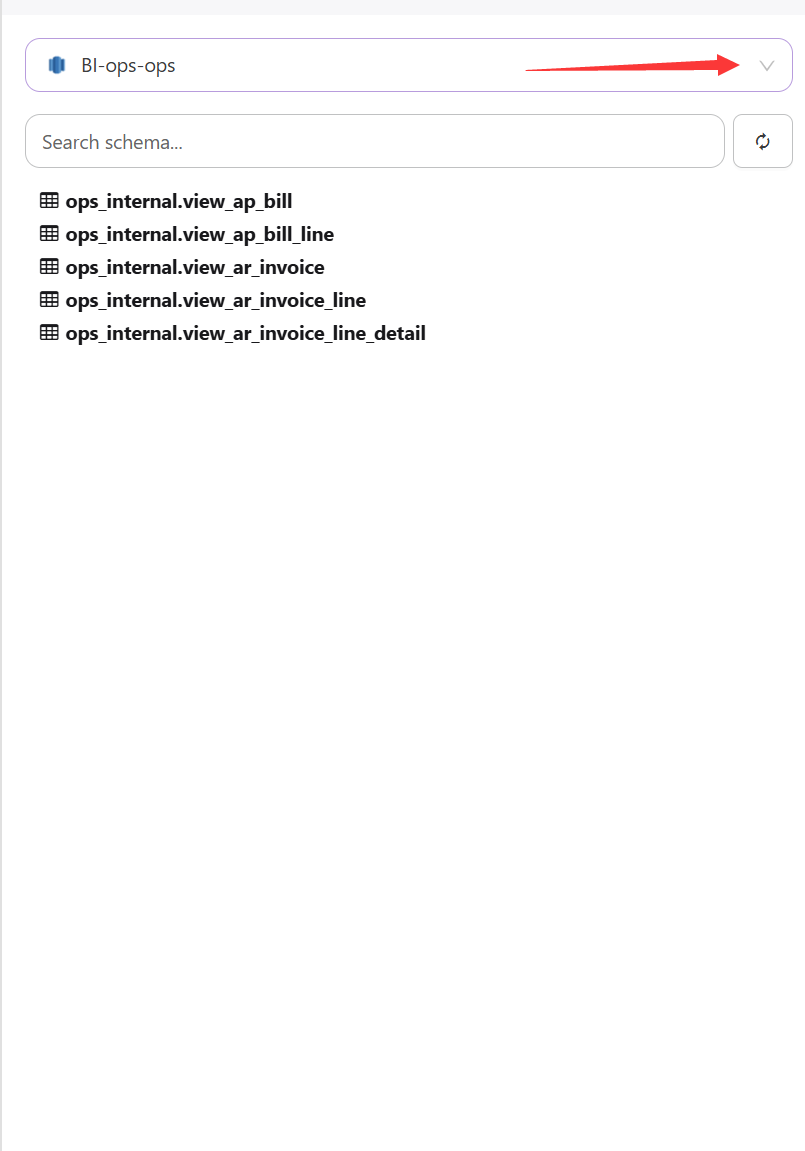
Visualizations
Each query can have one or more visualizations (charts or tables) built from its result set.
Creating a Visualization
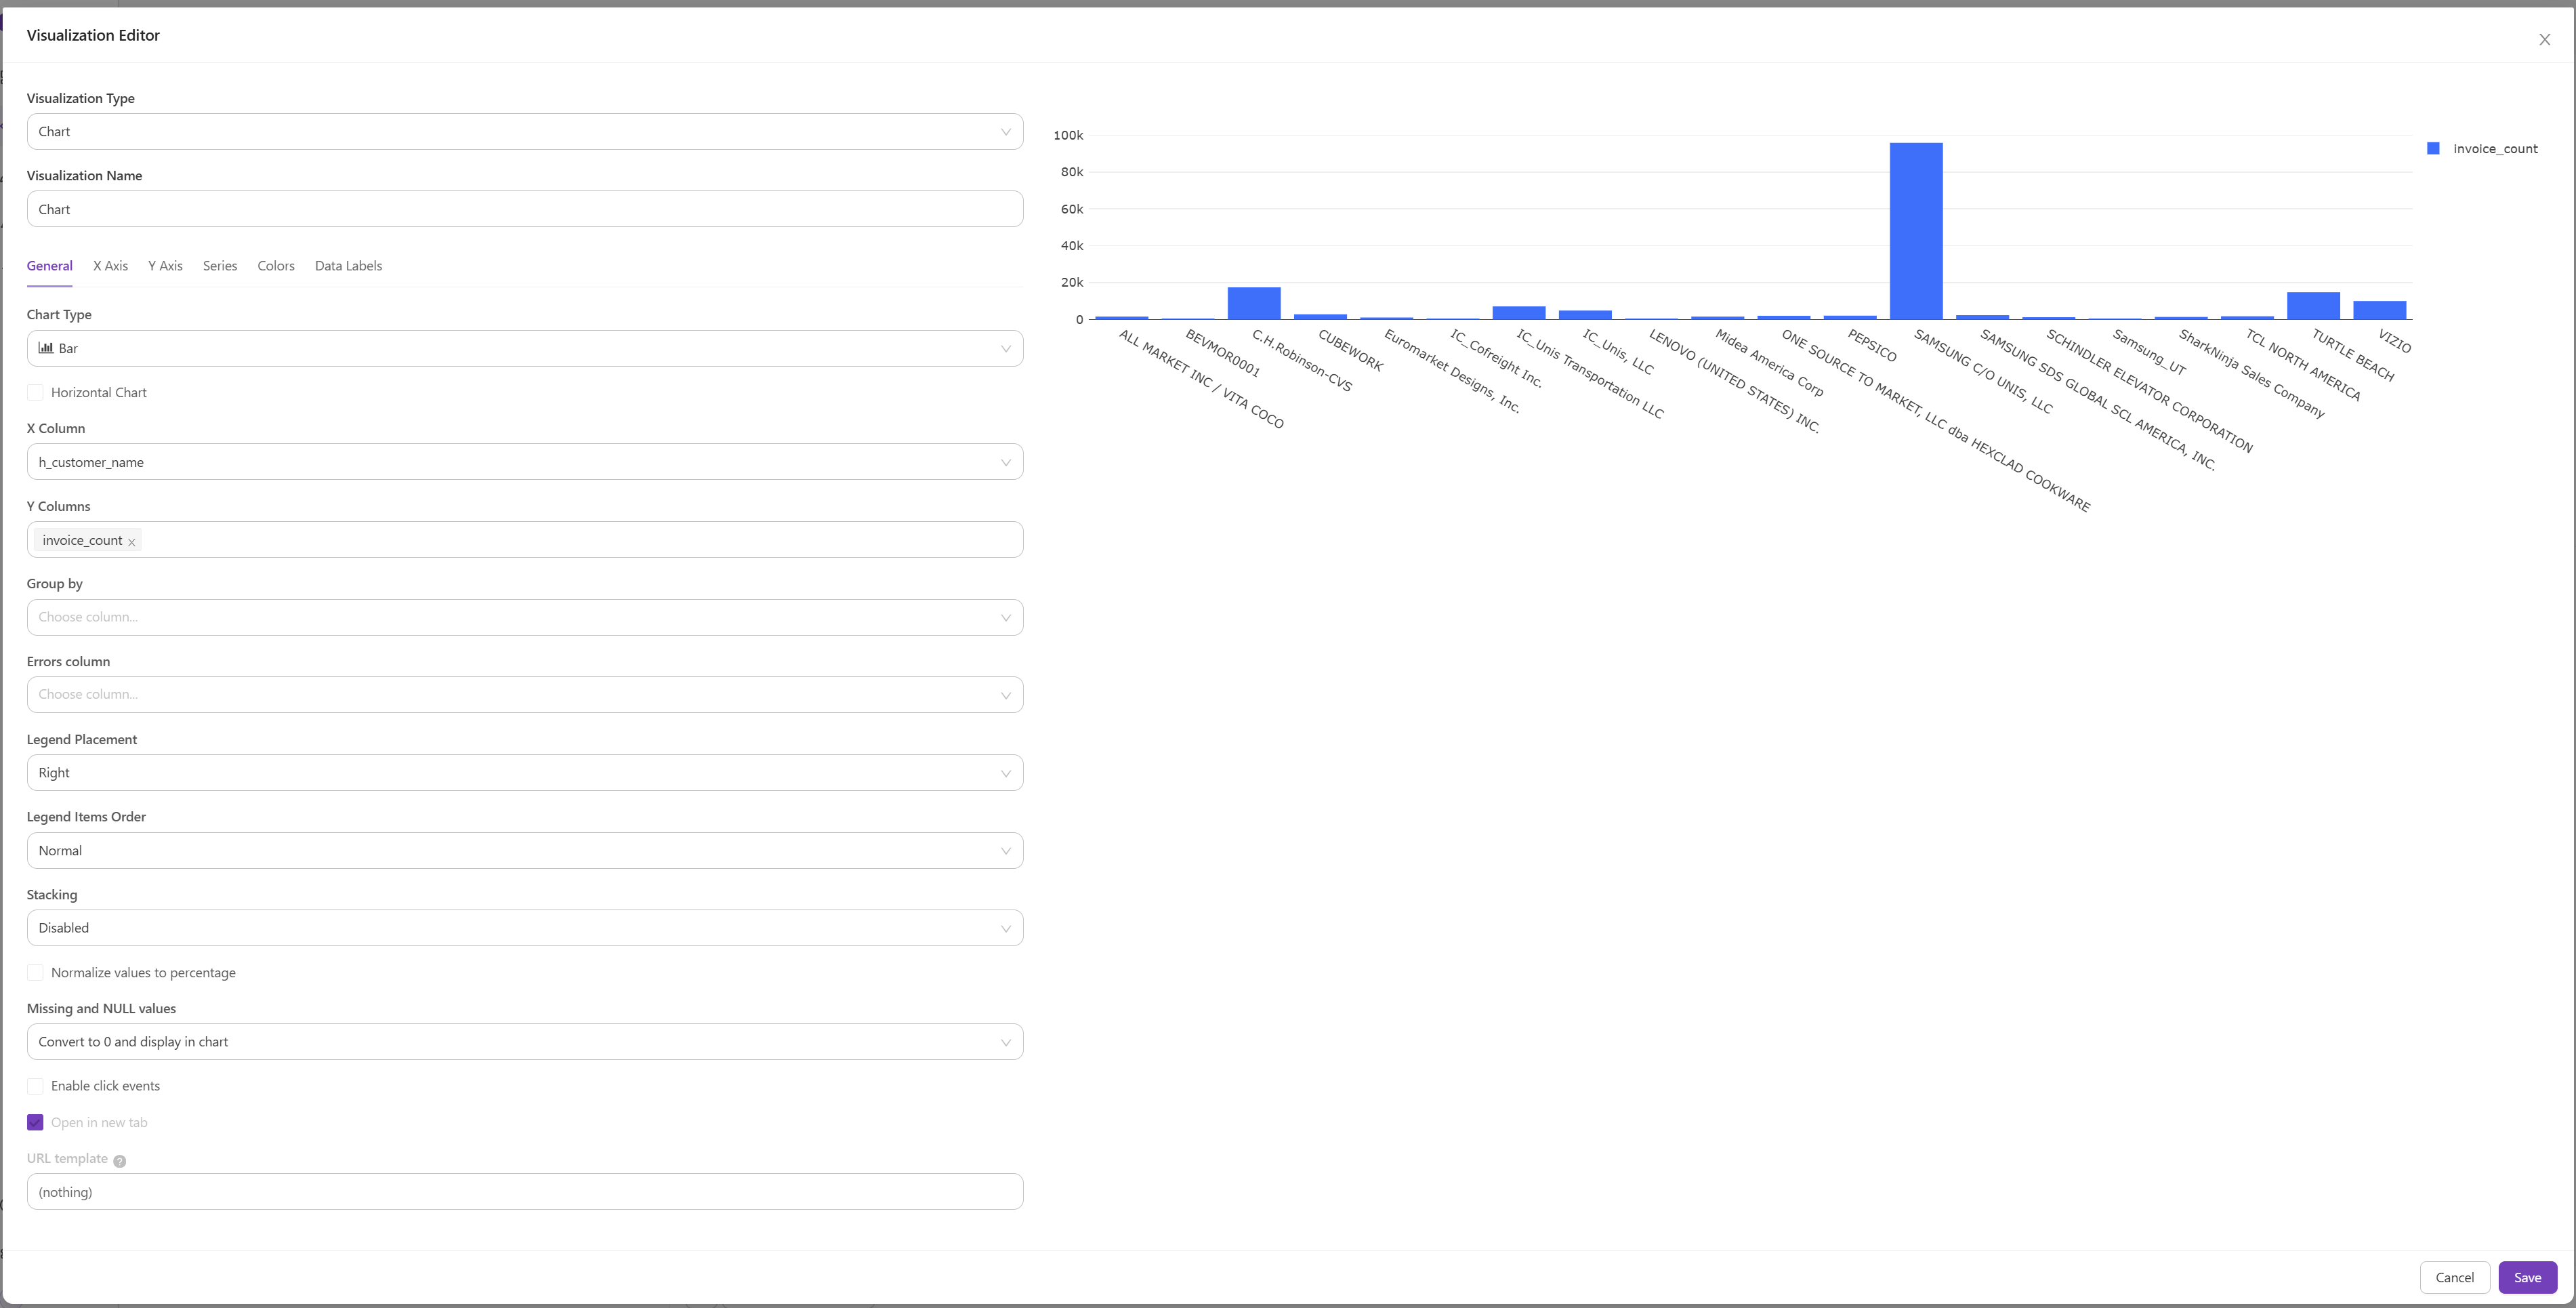
- After running a query, click + New Visualization below the results table.
- Choose a chart type:
- Table — default grid view
- Chart — line, bar, pie, scatter, etc.
- Counter — single large number display
- Map — geographic visualization
- Cohort — retention analysis
- Configure the X axis, Y axis, grouping, and other options.
- Click Save to store the visualization.
Chart Types
| Type | Best Used For |
|---|---|
| Line | Trends over time |
| Bar | Comparing categories |
| Pie / Donut | Proportion of a whole |
| Scatter | Correlation between variables |
| Counter | KPI / single metric highlight |
| Table | Detailed data display |
Dashboards
A Dashboard is a collection of visualizations displayed together on one page.
Creating a Dashboard
- Click Dashboards in the top navigation.
- Click + New Dashboard.
- Enter a dashboard name and click Save.
Adding Widgets
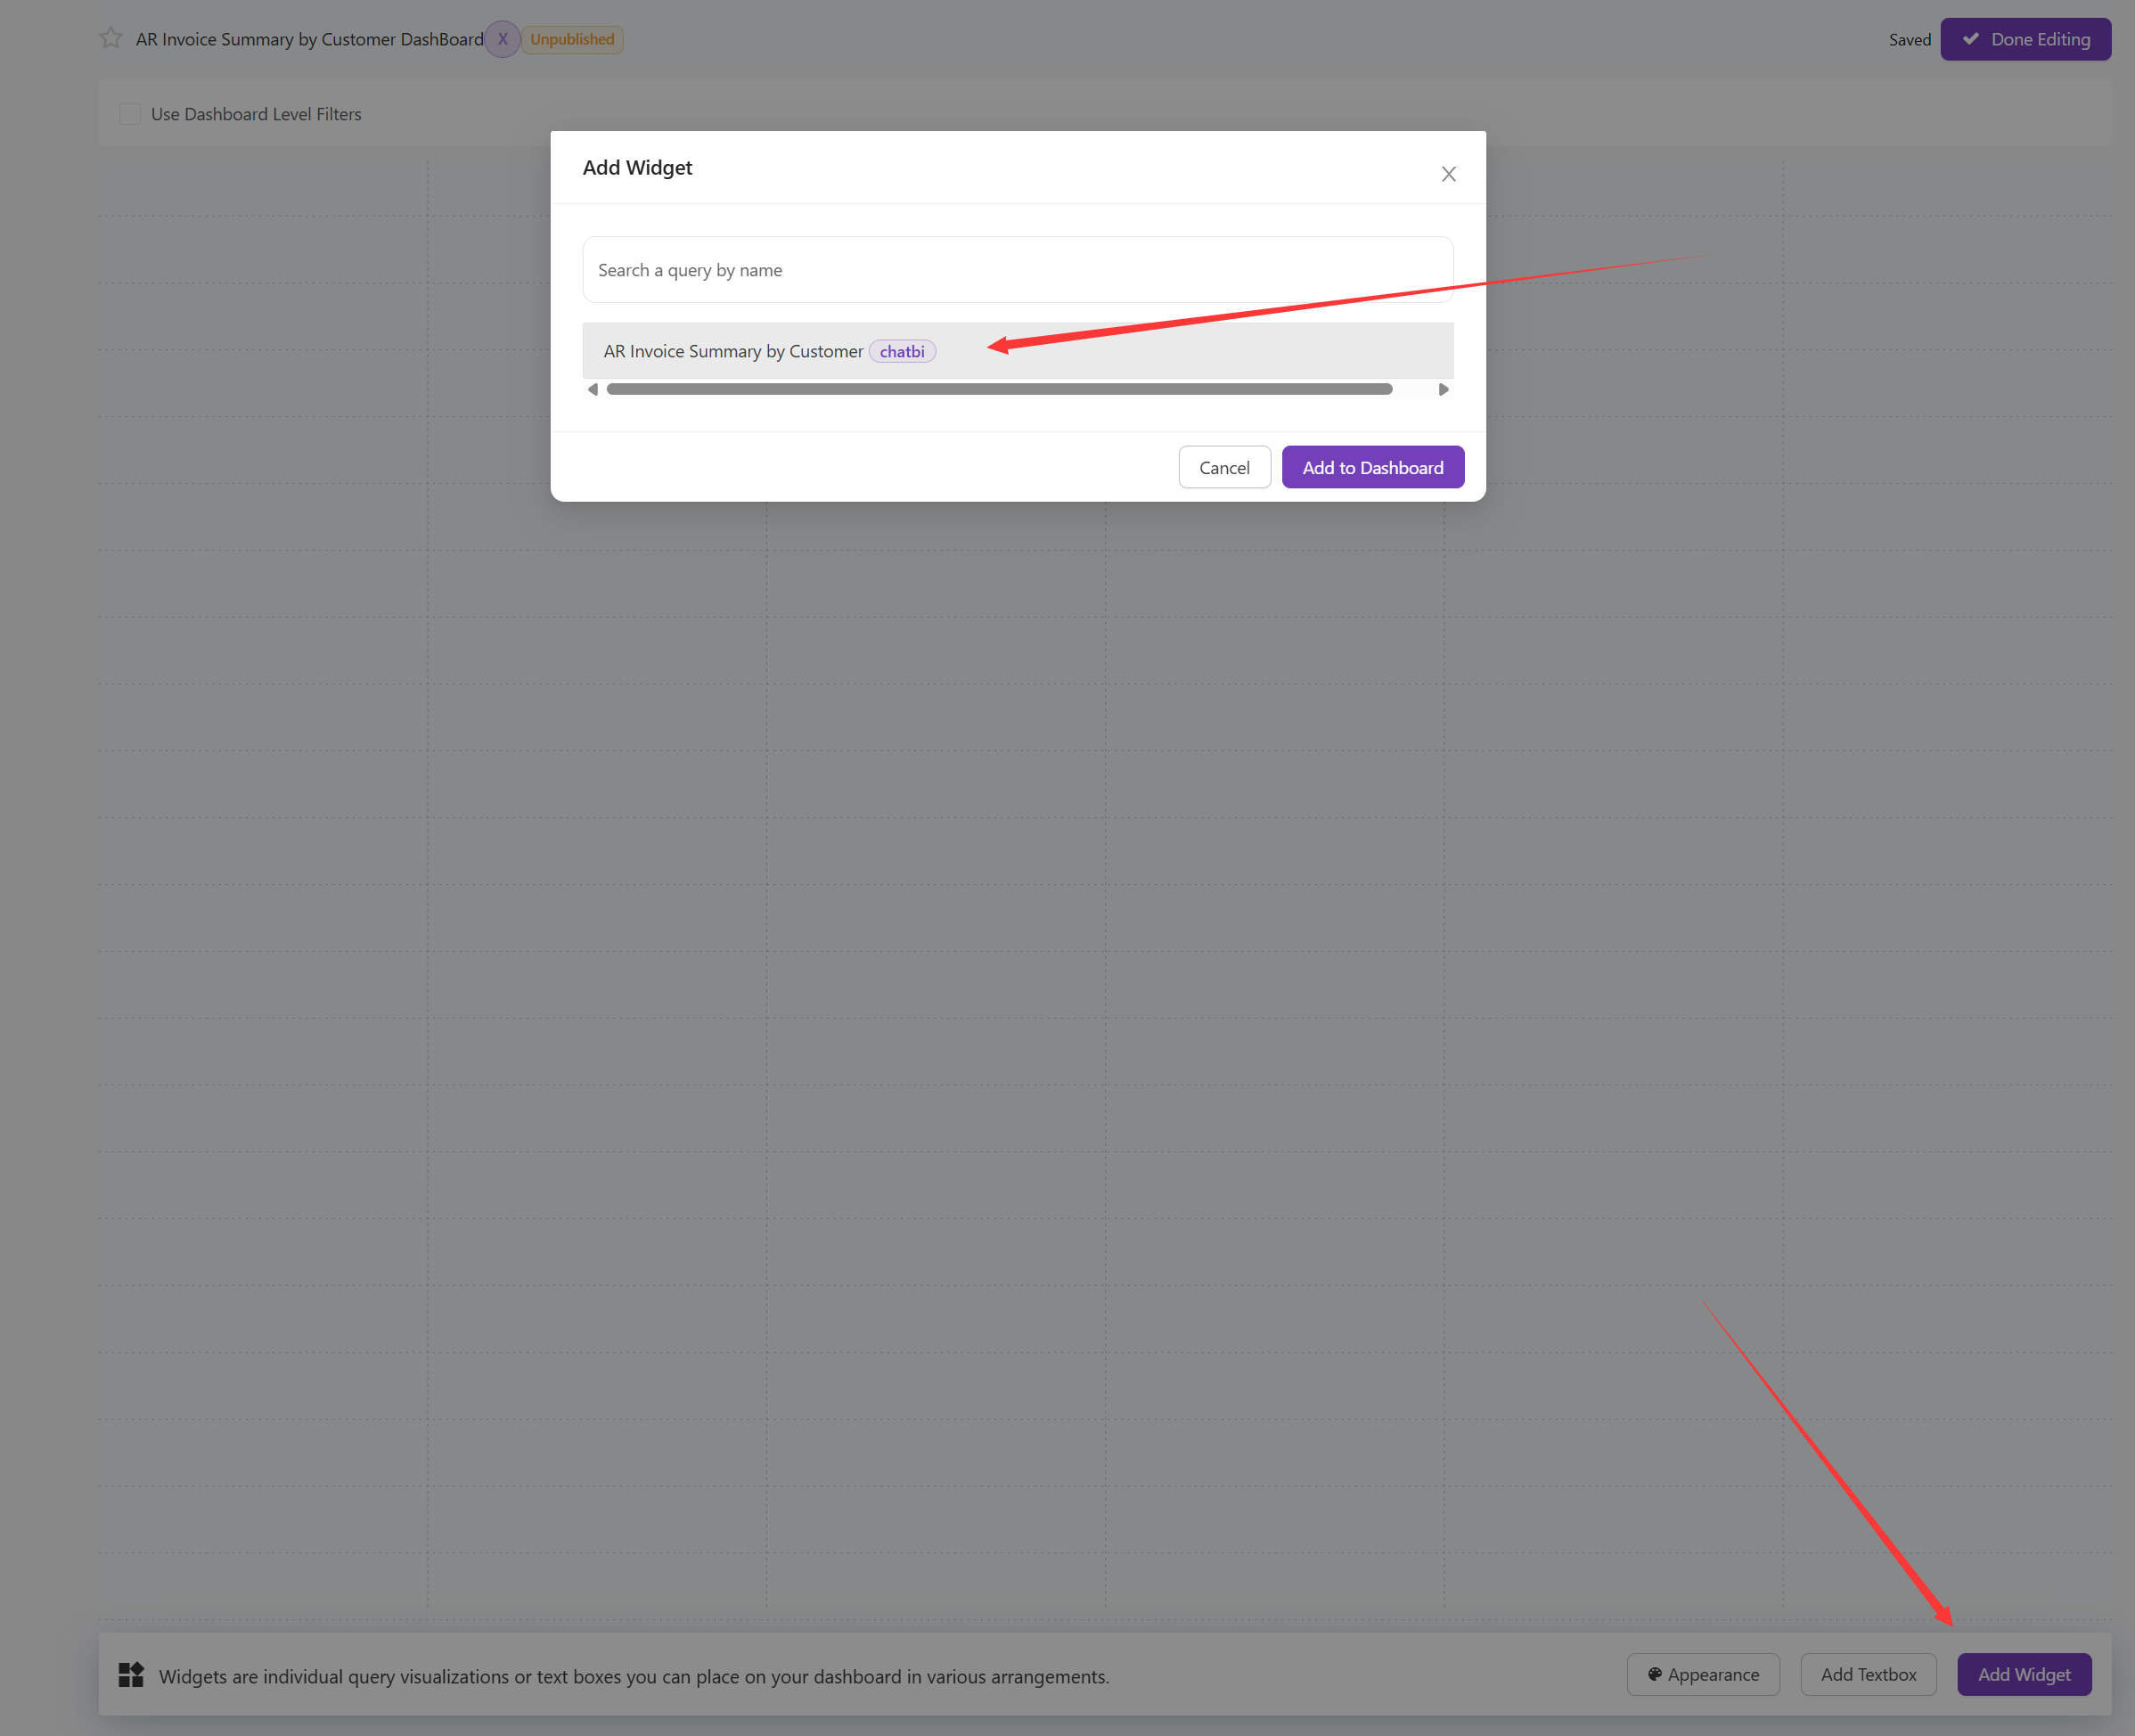
- Open a dashboard and click Edit.
- Click + Add Widget.
- Search for an existing query, select a visualization, and click Add to Dashboard.
- Drag and resize widgets to arrange the layout.
- Click Done Editing to save.
Dashboard Filters
If query parameters exist (e.g., ), they appear as filter controls at the top of the dashboard. Users can adjust them to dynamically update all connected widgets.
Sharing a Dashboard
- Open a dashboard.
- Click the Share button (or the share icon).
- You can:
- Share with specific users — they must have a BI-Dashboard account.
- Enable public access — generates a shareable link that does not require login.
API Access
BI-Dashboard provides a REST API that allows you to programmatically execute queries and retrieve results. This is useful for integrating dashboard data into external applications, scripts, or automated workflows.
API Key
Each user account has a personal API key. To find yours:
- Log in to https://bi-dashboard.item.com.
- Click your profile icon (top-right corner) → Edit Profile.
- Scroll to the API Key section and copy the key.
Keep your API key private. Do not commit it to source control or share it publicly.
Execute a Query and Get Results
Every saved query has a numeric ID visible in its URL: https://bi-dashboard.item.com/queries/{query_id}
Use the following API call to retrieve the latest cached results for a query:
bash
curl "https://bi-dashboard.item.com/api/queries/{query_id}/results.json?api_key={your_api_key}"Example:
bash
curl "https://bi-dashboard.item.com/api/queries/123/results.json?api_key=abcdef1234567890"Response format:
json
{
  "query_result": {
    "data": {
      "columns": [
        {"name": "order_id", "type": "integer"},
        {"name": "status",   "type": "string"}
      ],
      "rows": [
        {"order_id": 1001, "status": "Shipped"},
        {"order_id": 1002, "status": "Pending"}
      ]
    },
    "retrieved_at": "2026-08-17T08:00:00Z"
  }
}
The response returns the most recently cached result. If the query has never been run or the cache has expired, you may receive an empty result — run the query manually in the UI first to populate the cache.
Worked Example: AR Invoice Summary
The following is a complete end-to-end example using the BI-ops-ops data source and the ops_internal.view_ar_invoice table.
Step 1 — Create and Run the Query
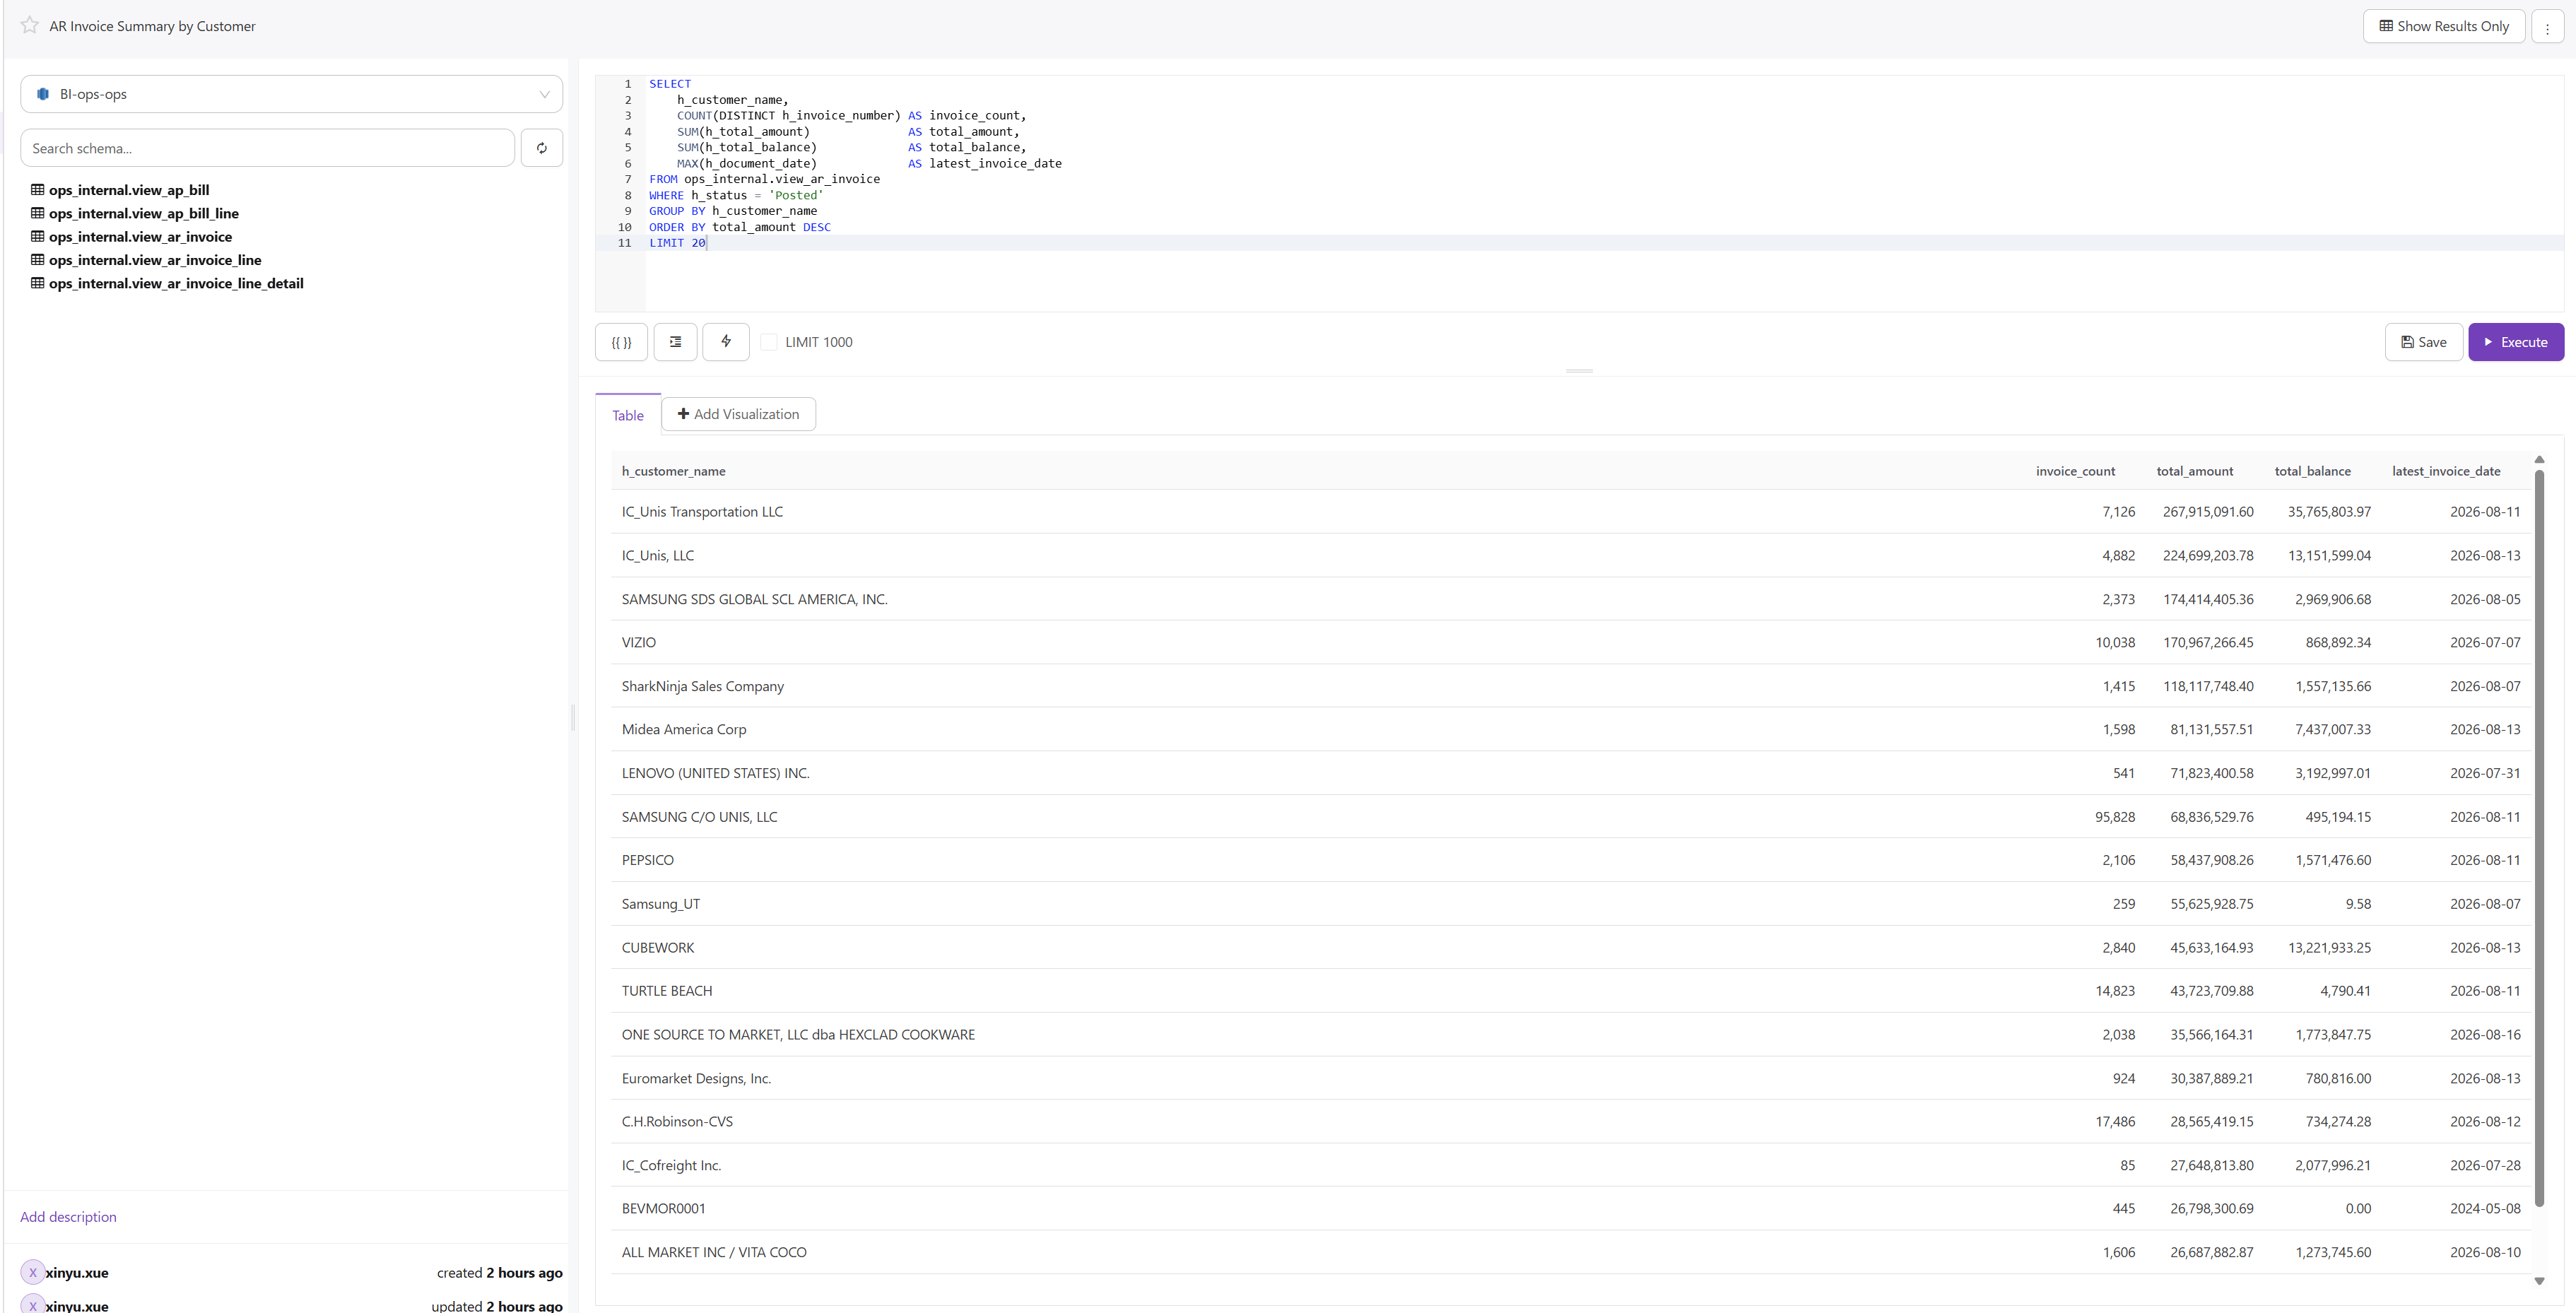
In BI-Dashboard, create a new query with data source BI-ops-ops and paste the following SQL:
sql
SELECT
    h_customer_name,
    COUNT(DISTINCT h_invoice_number) AS invoice_count,
    SUM(h_total_amount)              AS total_amount,
    SUM(h_total_balance)             AS total_balance,
    MAX(h_document_date)             AS latest_invoice_date
FROM ops_internal.view_ar_invoice
WHERE h_status = 'Posted'
GROUP BY h_customer_name
ORDER BY total_amount DESC
LIMIT 20
Click Execute to run it. You should see a result table like this (top 3 rows shown):
| h_customer_name | invoice_count | total_amount | total_balance | latest_invoice_date |
|---|---|---|---|---|
| IC_Unis Transportation LLC | 7,126 | 267,915,091.60 | 35,765,803.97 | 2026-08-14 |
| IC_Unis, LLC | 4,882 | 224,699,203.78 | 13,151,599.04 | 2026-08-14 |
| SAMSUNG SDS GLOBAL SCL AMERICA, INC. | 2,373 | 174,414,405.36 | 2,969,906.68 | 2026-08-13 |
Save the query as "AR Invoice Summary by Customer".
Step 2 — Publish the Query
⚠️ You must publish the query before its results are accessible via the API.
Click the Publish button in the top-right corner of the query editor. The query status changes from Draft to published, making it visible to all users with data source access and enabling API retrieval.
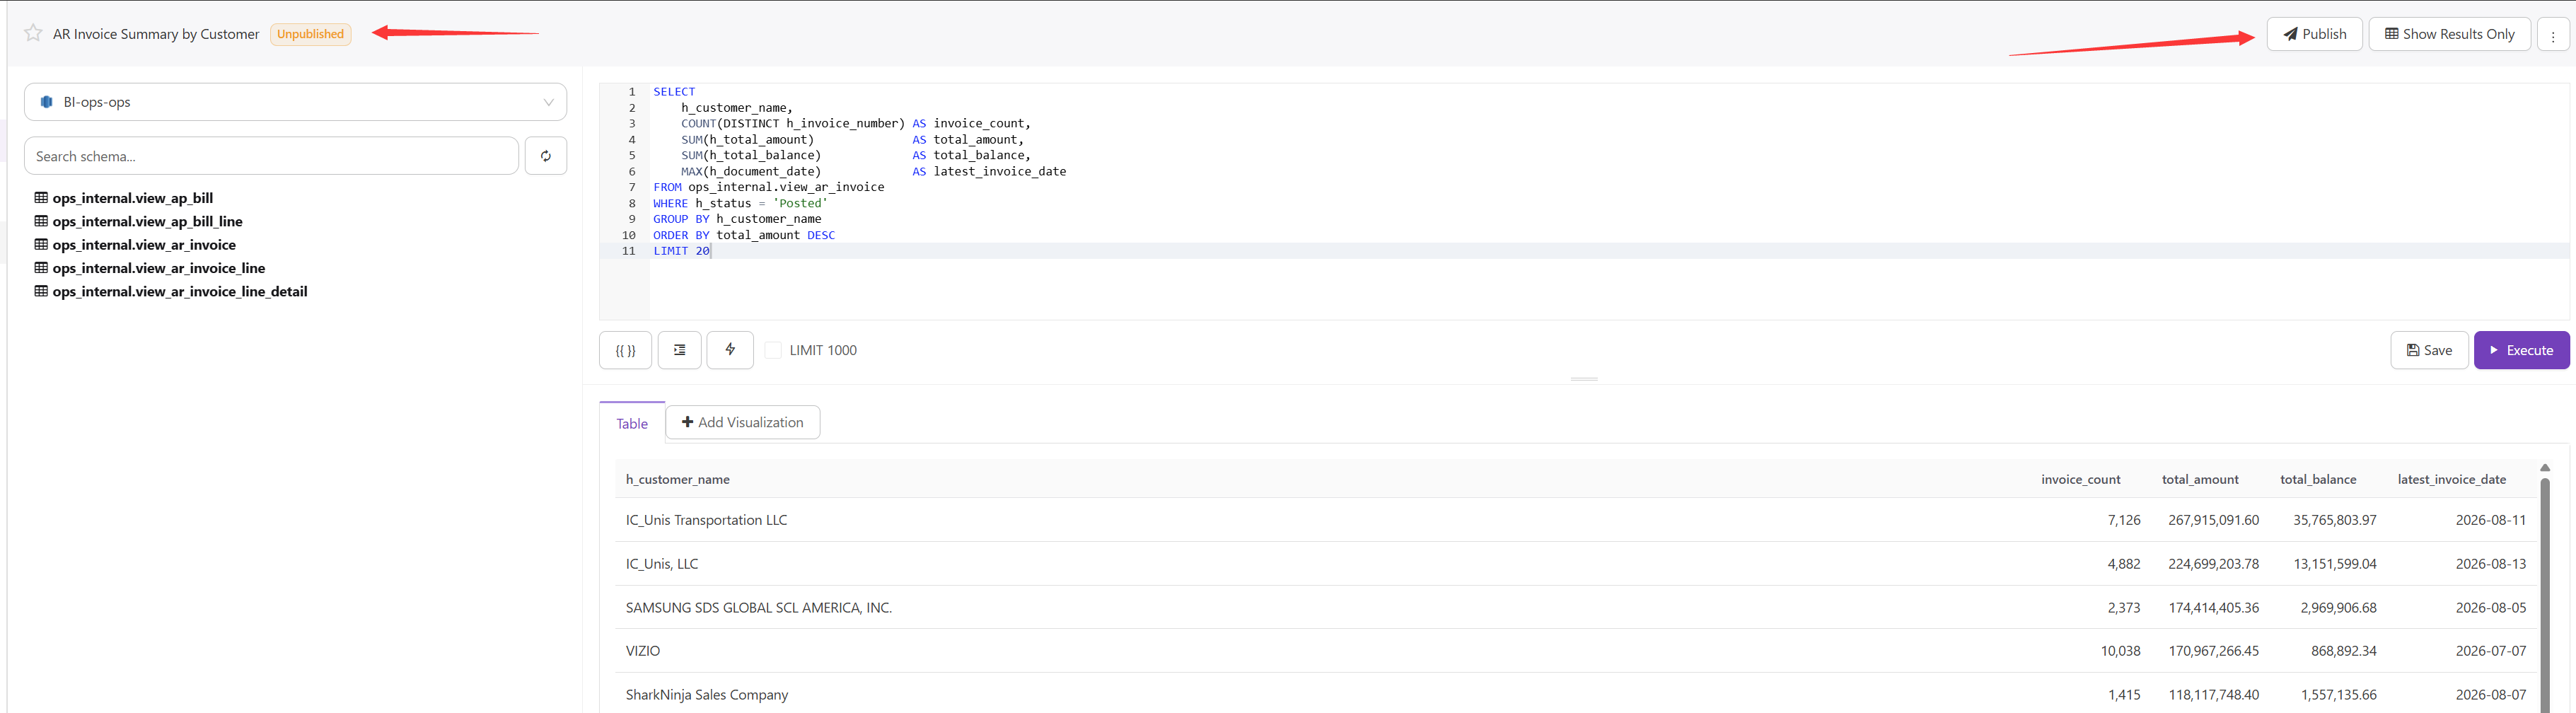
The published query URL is: https://bi-dashboard.item.com/queries/9764
Step 3 — Retrieve Results via API
Once published, use your API key to fetch the results programmatically.
curl:
bash
curl "https://bi-dashboard.item.com/api/queries/9764/results.json?api_key=YOUR_API_KEY"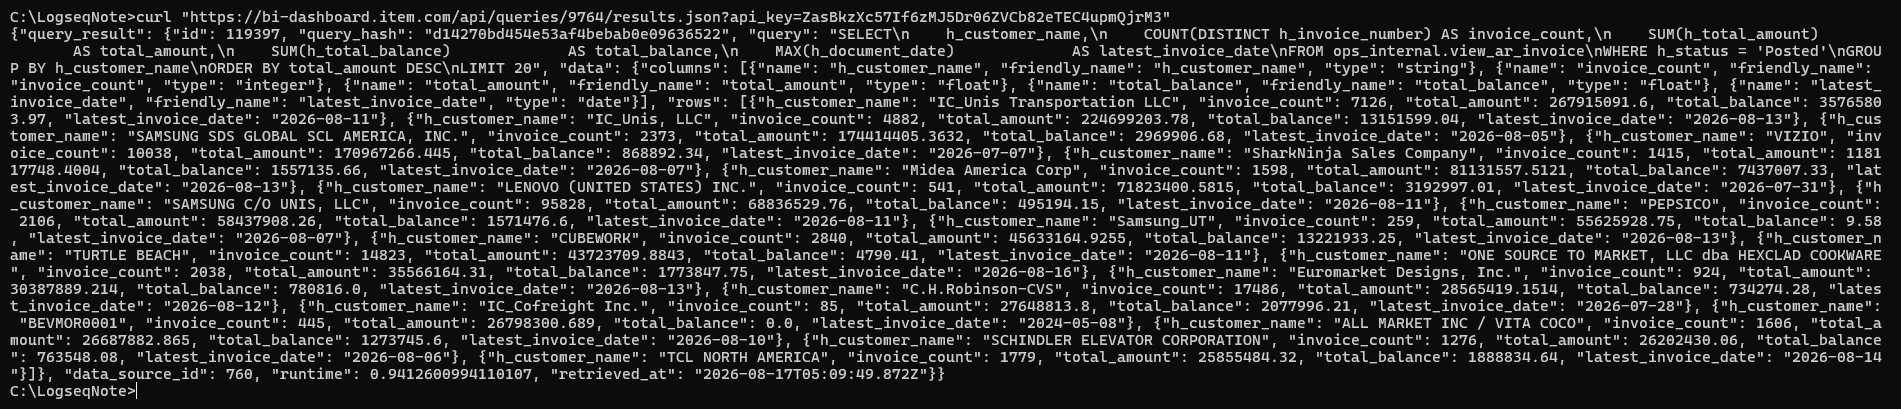
Python:
python
import requests

API_KEY  = "your_api_key_here"
QUERY_ID = 9764
BASE_URL = "https://bi-dashboard.item.com"

url  = f"{BASE_URL}/api/queries/{QUERY_ID}/results.json"
resp = requests.get(url, params={"api_key": API_KEY})
resp.raise_for_status()

data = resp.json()["query_result"]["data"]
print(data["columns"])   # column metadata
for row in data["rows"]:
    print(row)
Sample response (truncated):
json
{
  "query_result": {
    "data": {
      "columns": [
        {"name": "h_customer_name",    "type": "string"},
        {"name": "invoice_count",      "type": "integer"},
        {"name": "total_amount",       "type": "float"},
        {"name": "total_balance",      "type": "float"},
        {"name": "latest_invoice_date","type": "datetime"}
      ],
      "rows": [
        {
          "h_customer_name": "IC_Unis Transportation LLC",
          "invoice_count": 7126,
          "total_amount": 267915091.60,
          "total_balance": 35765803.97,
          "latest_invoice_date": "2026-08-14"
        }
      ]
    },
    "retrieved_at": "2026-08-17T08:00:00Z"
  }
}
Important: Queries Must Be Published
⚠️ You must publish a query before its results are accessible via the API.
An unpublished (draft) query is private to its owner and cannot be accessed by API calls, even with a valid API key.
To publish a query:
- Open the query in BI-Dashboard.
- Click the Publish button in the top-right area of the query editor.
- Confirm — the query is now accessible to all users with data source permissions, and its results can be retrieved via API.
If you receive an empty response or a 404 / permission error when calling the API, check that the query has been published.
Tips
- Keyboard shortcut:
Ctrl + Enterto run a query. - Fork a query: Click the fork icon to create a personal copy of a shared query.
- Download results: Click the download icon below the results table to export as CSV or Excel.
- Embed a chart: Each visualization has an embed code for integration into other pages.
Contact & Support
For access requests, questions, or bug reports, contact: