Appearance
- This guide covers the Dashboard functionality in the Cube system to help you quickly get started with Dashboard operations
Prerequisites
- You have obtained access permissions for the Cube system, and have successfully logged in
- If you do not have an account, please contact the BI department
- Cube system login link
- https://bi-cube.item.com
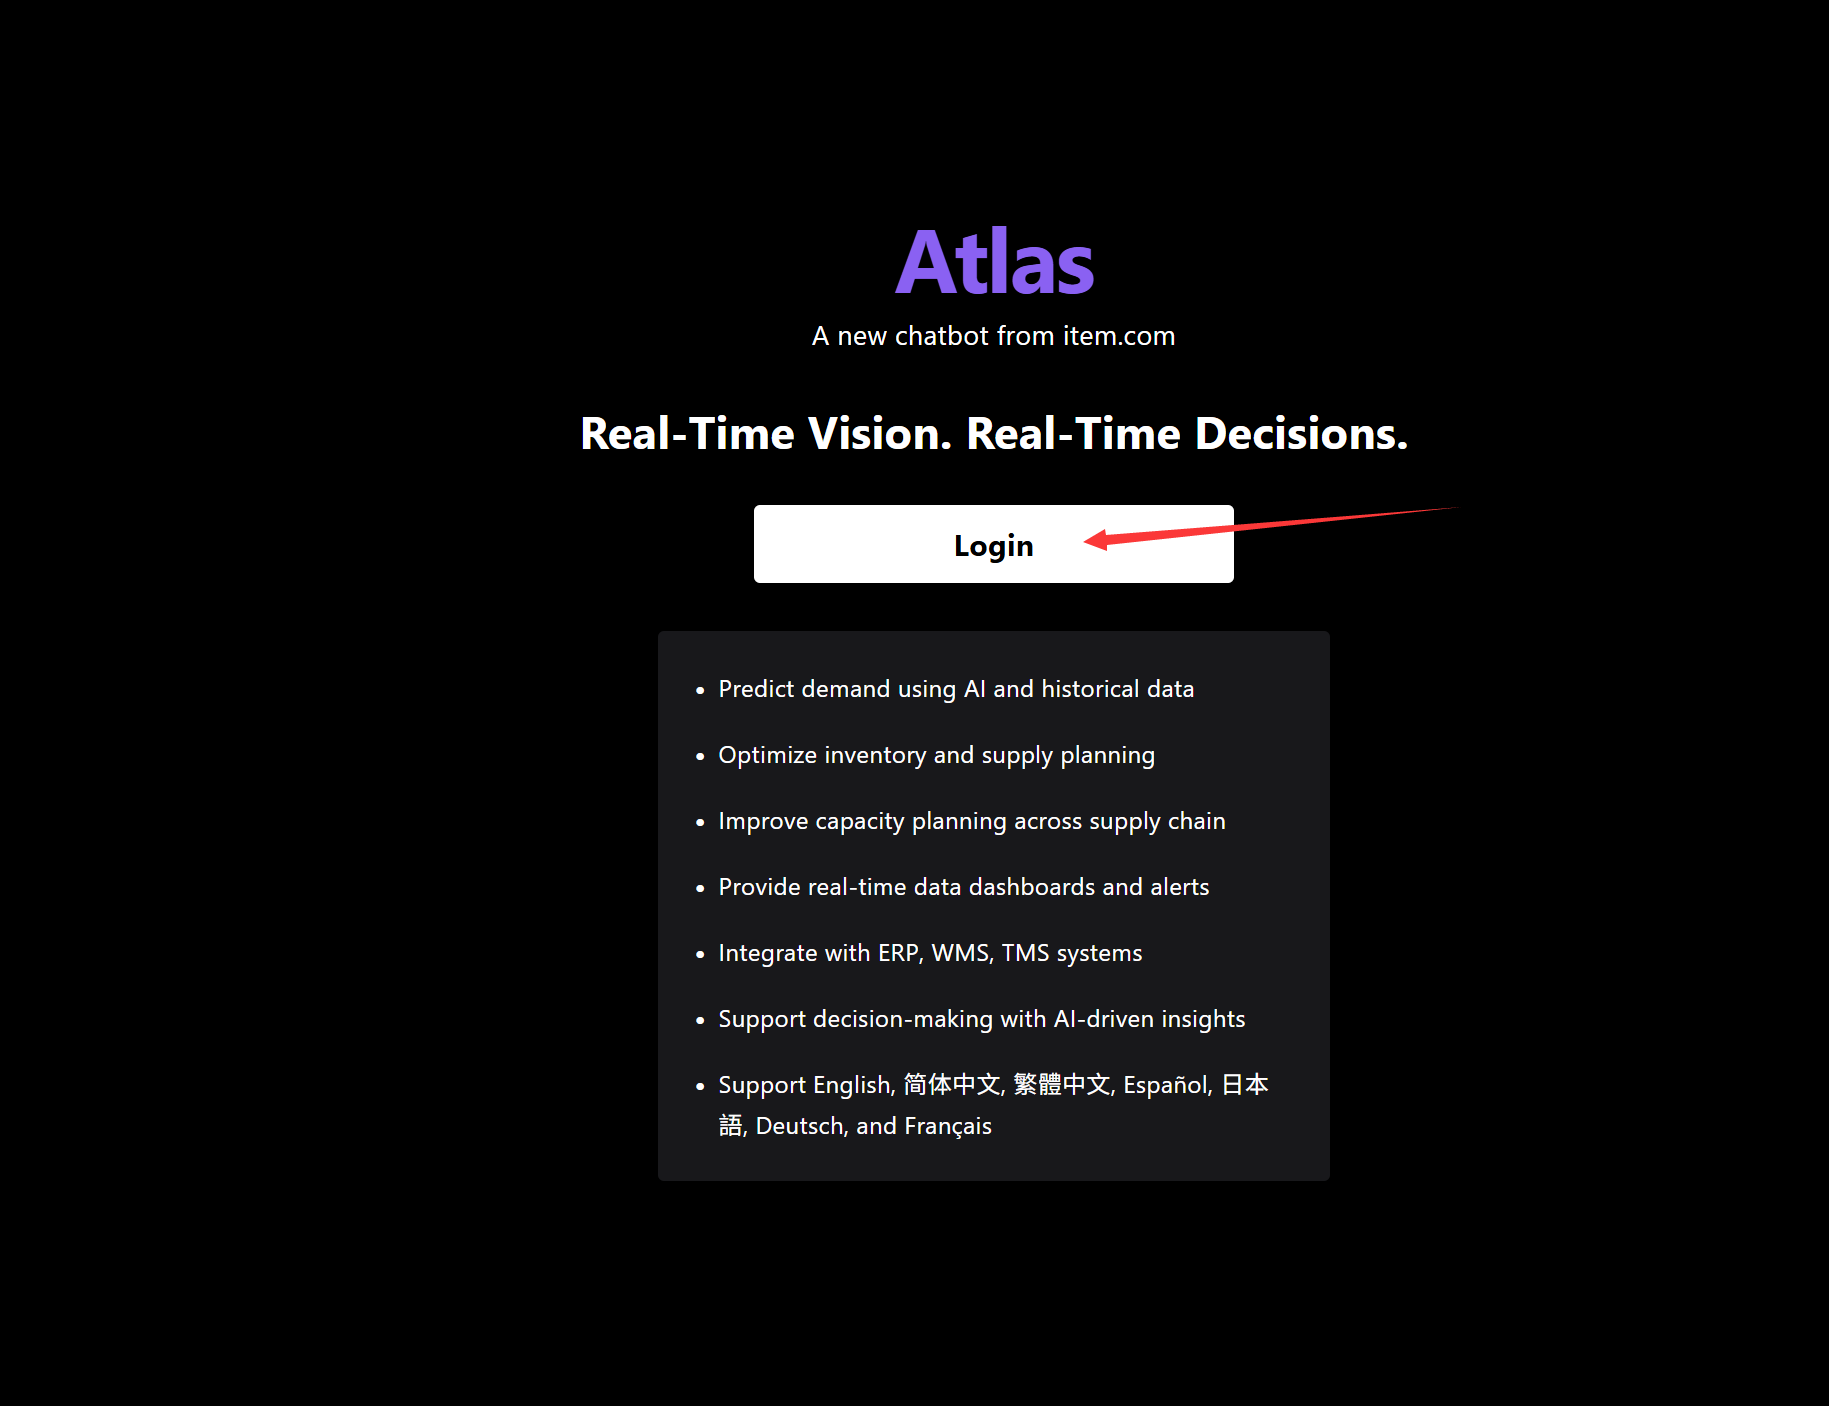
- Atlas requires company IAM authentication for login. If you do not have an account, please contact the Platform team
- Atlas login link
- https://chat.item.com
Viewing Dashboards
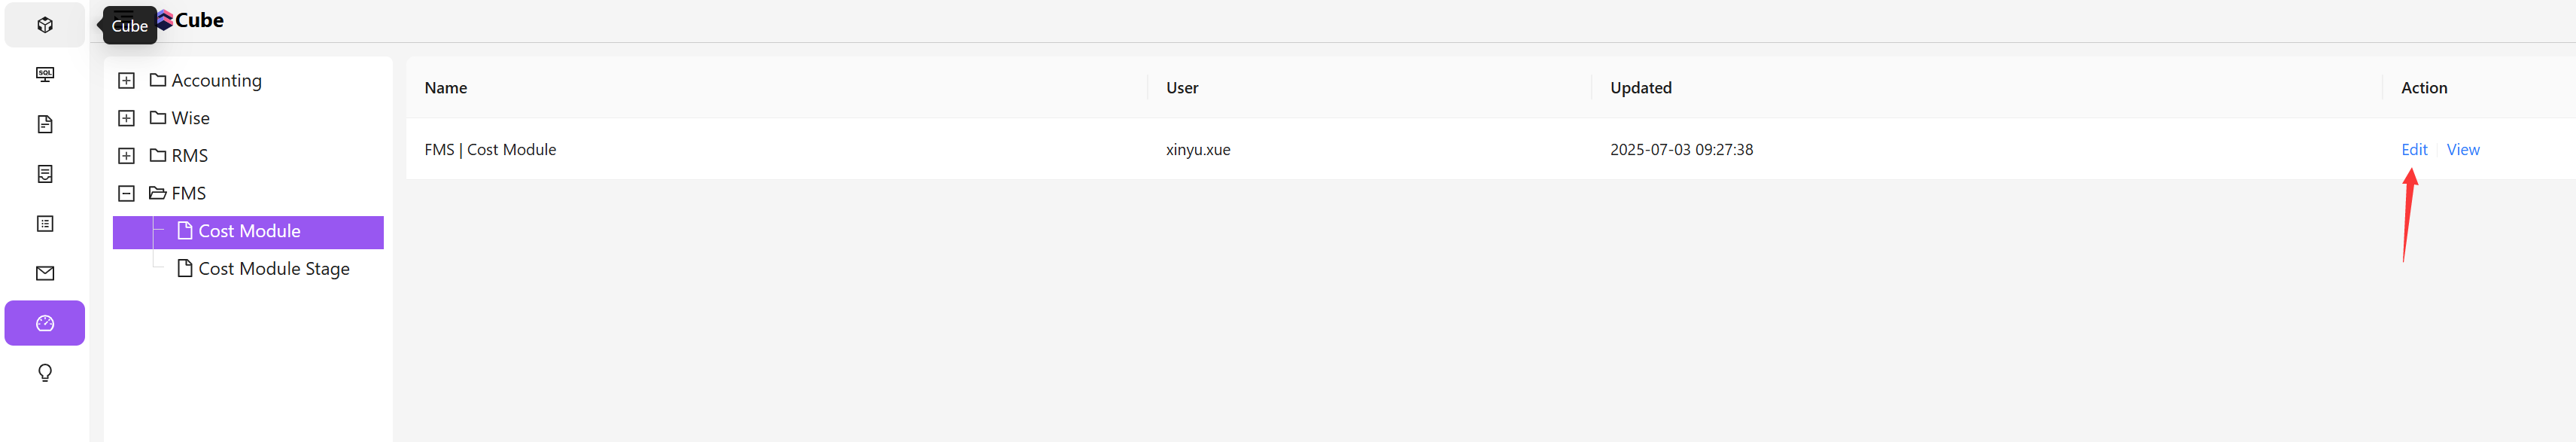
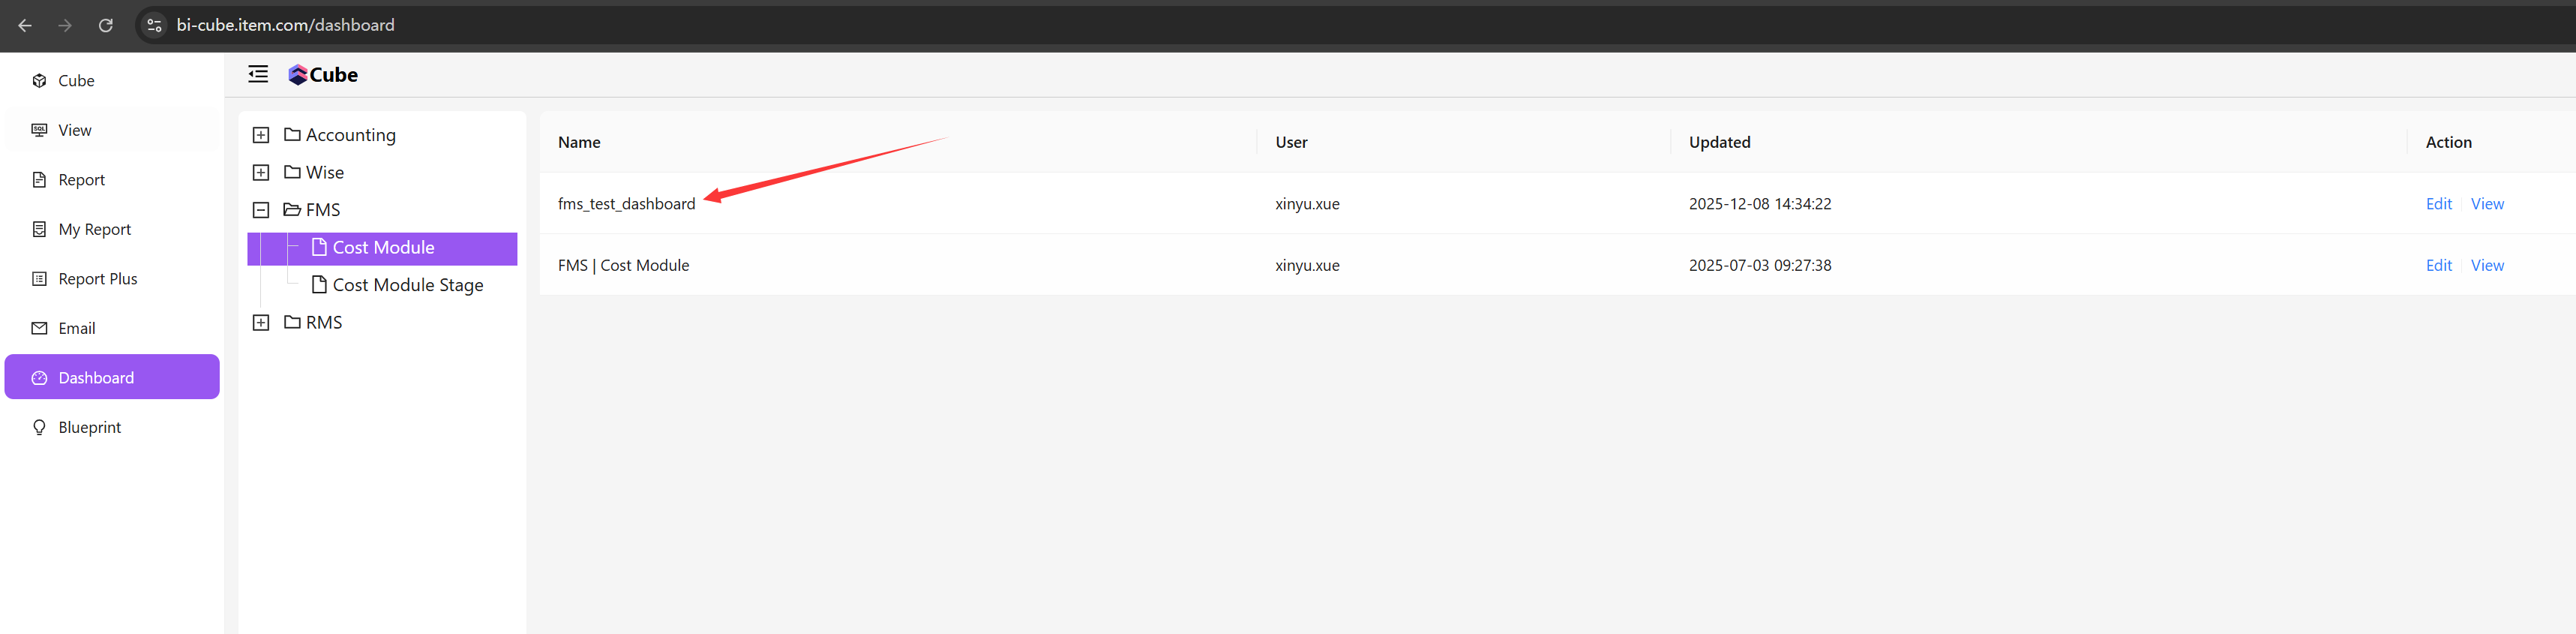
After logging into the Cube system, select the Dashboard tab on the left side to enter the Dashboard list page
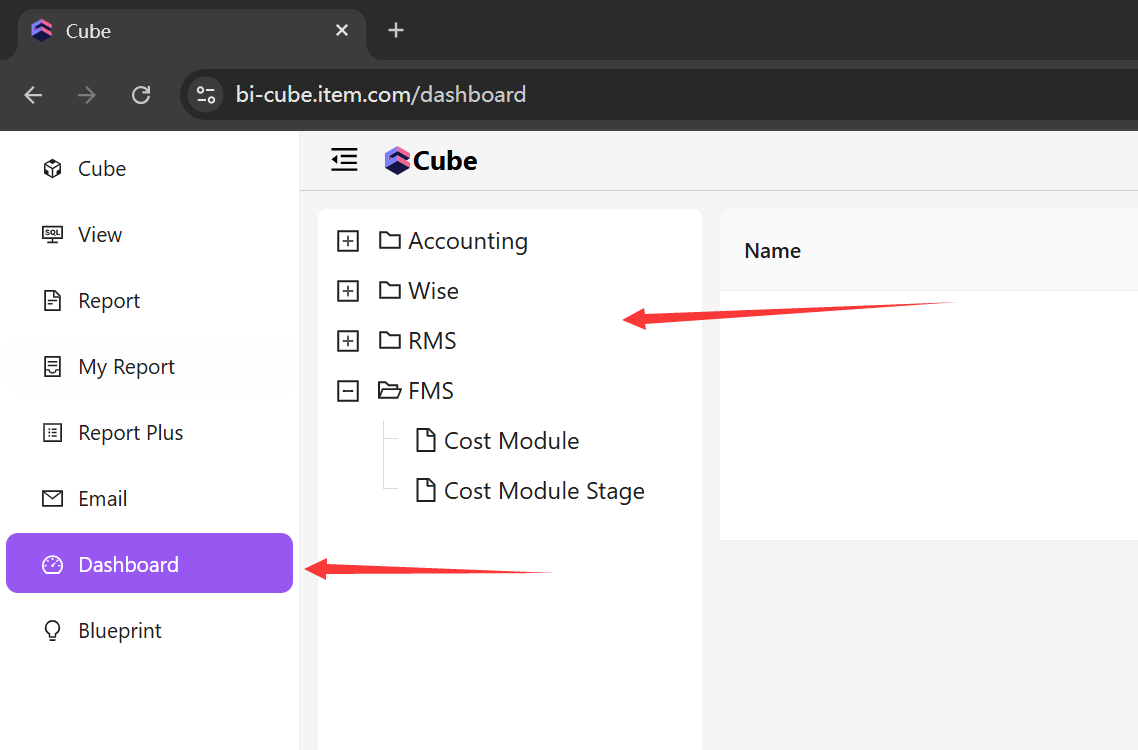
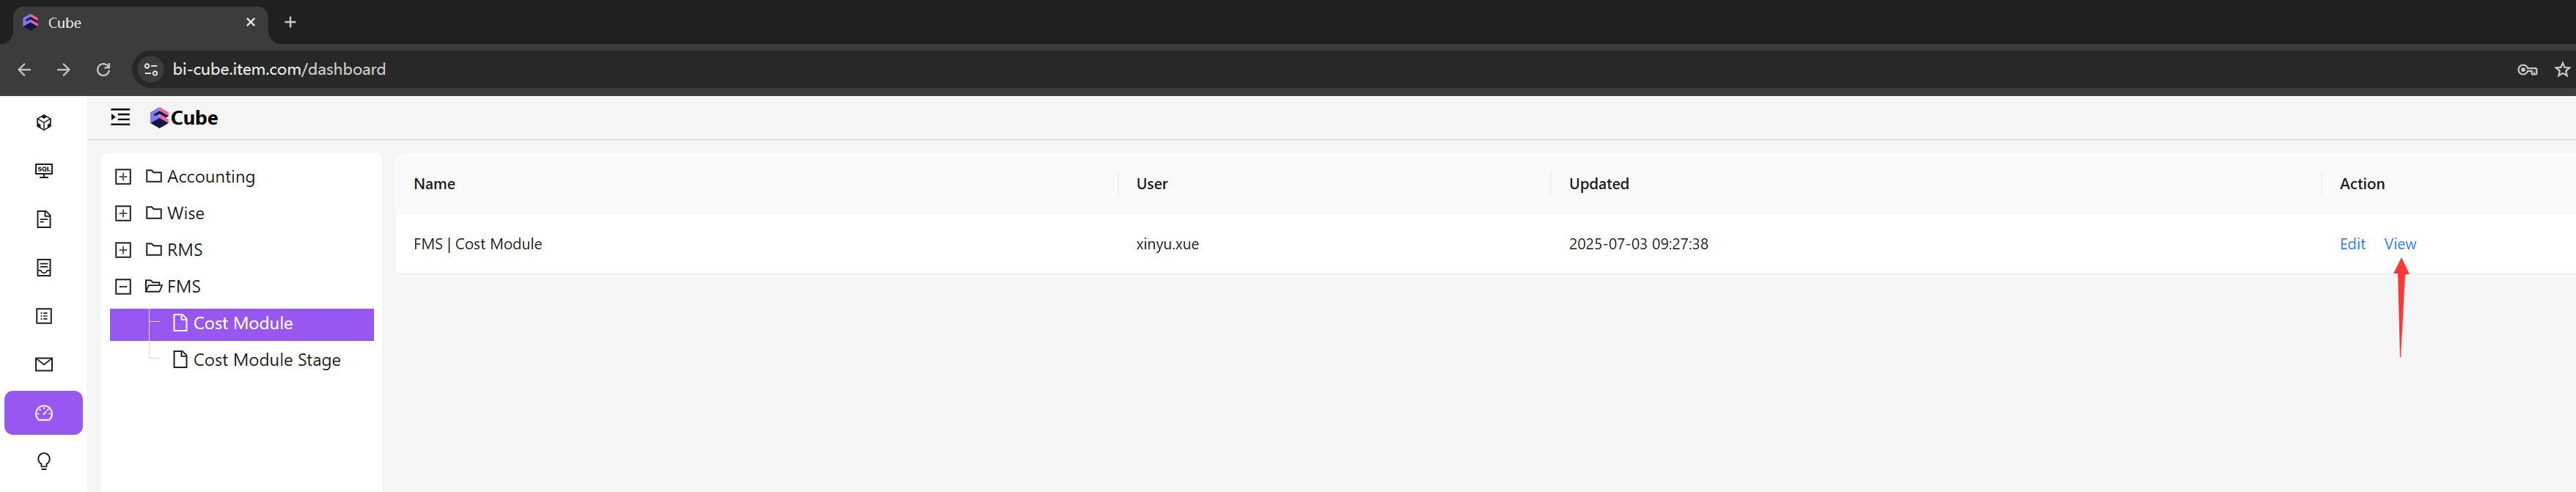
The primary tabs are organized by business system, and the secondary tabs represent business sub-items Taking the FMS project as an example, click on the Cost Module, then click View to access the Dashboard
Editing and Creating Dashboards
Editing
Similar to the previous step, after entering the Cube system and selecting the Dashboard tab on the left to access the Dashboard list page, instead of selecting View, choose Edit to enter the Dashboard editing mode (your account must have the appropriate permissions to perform this operation)
Click the edit button in the upper left corner to begin editing the Dashboard

You can drag and drop to reposition charts within the Dashboard
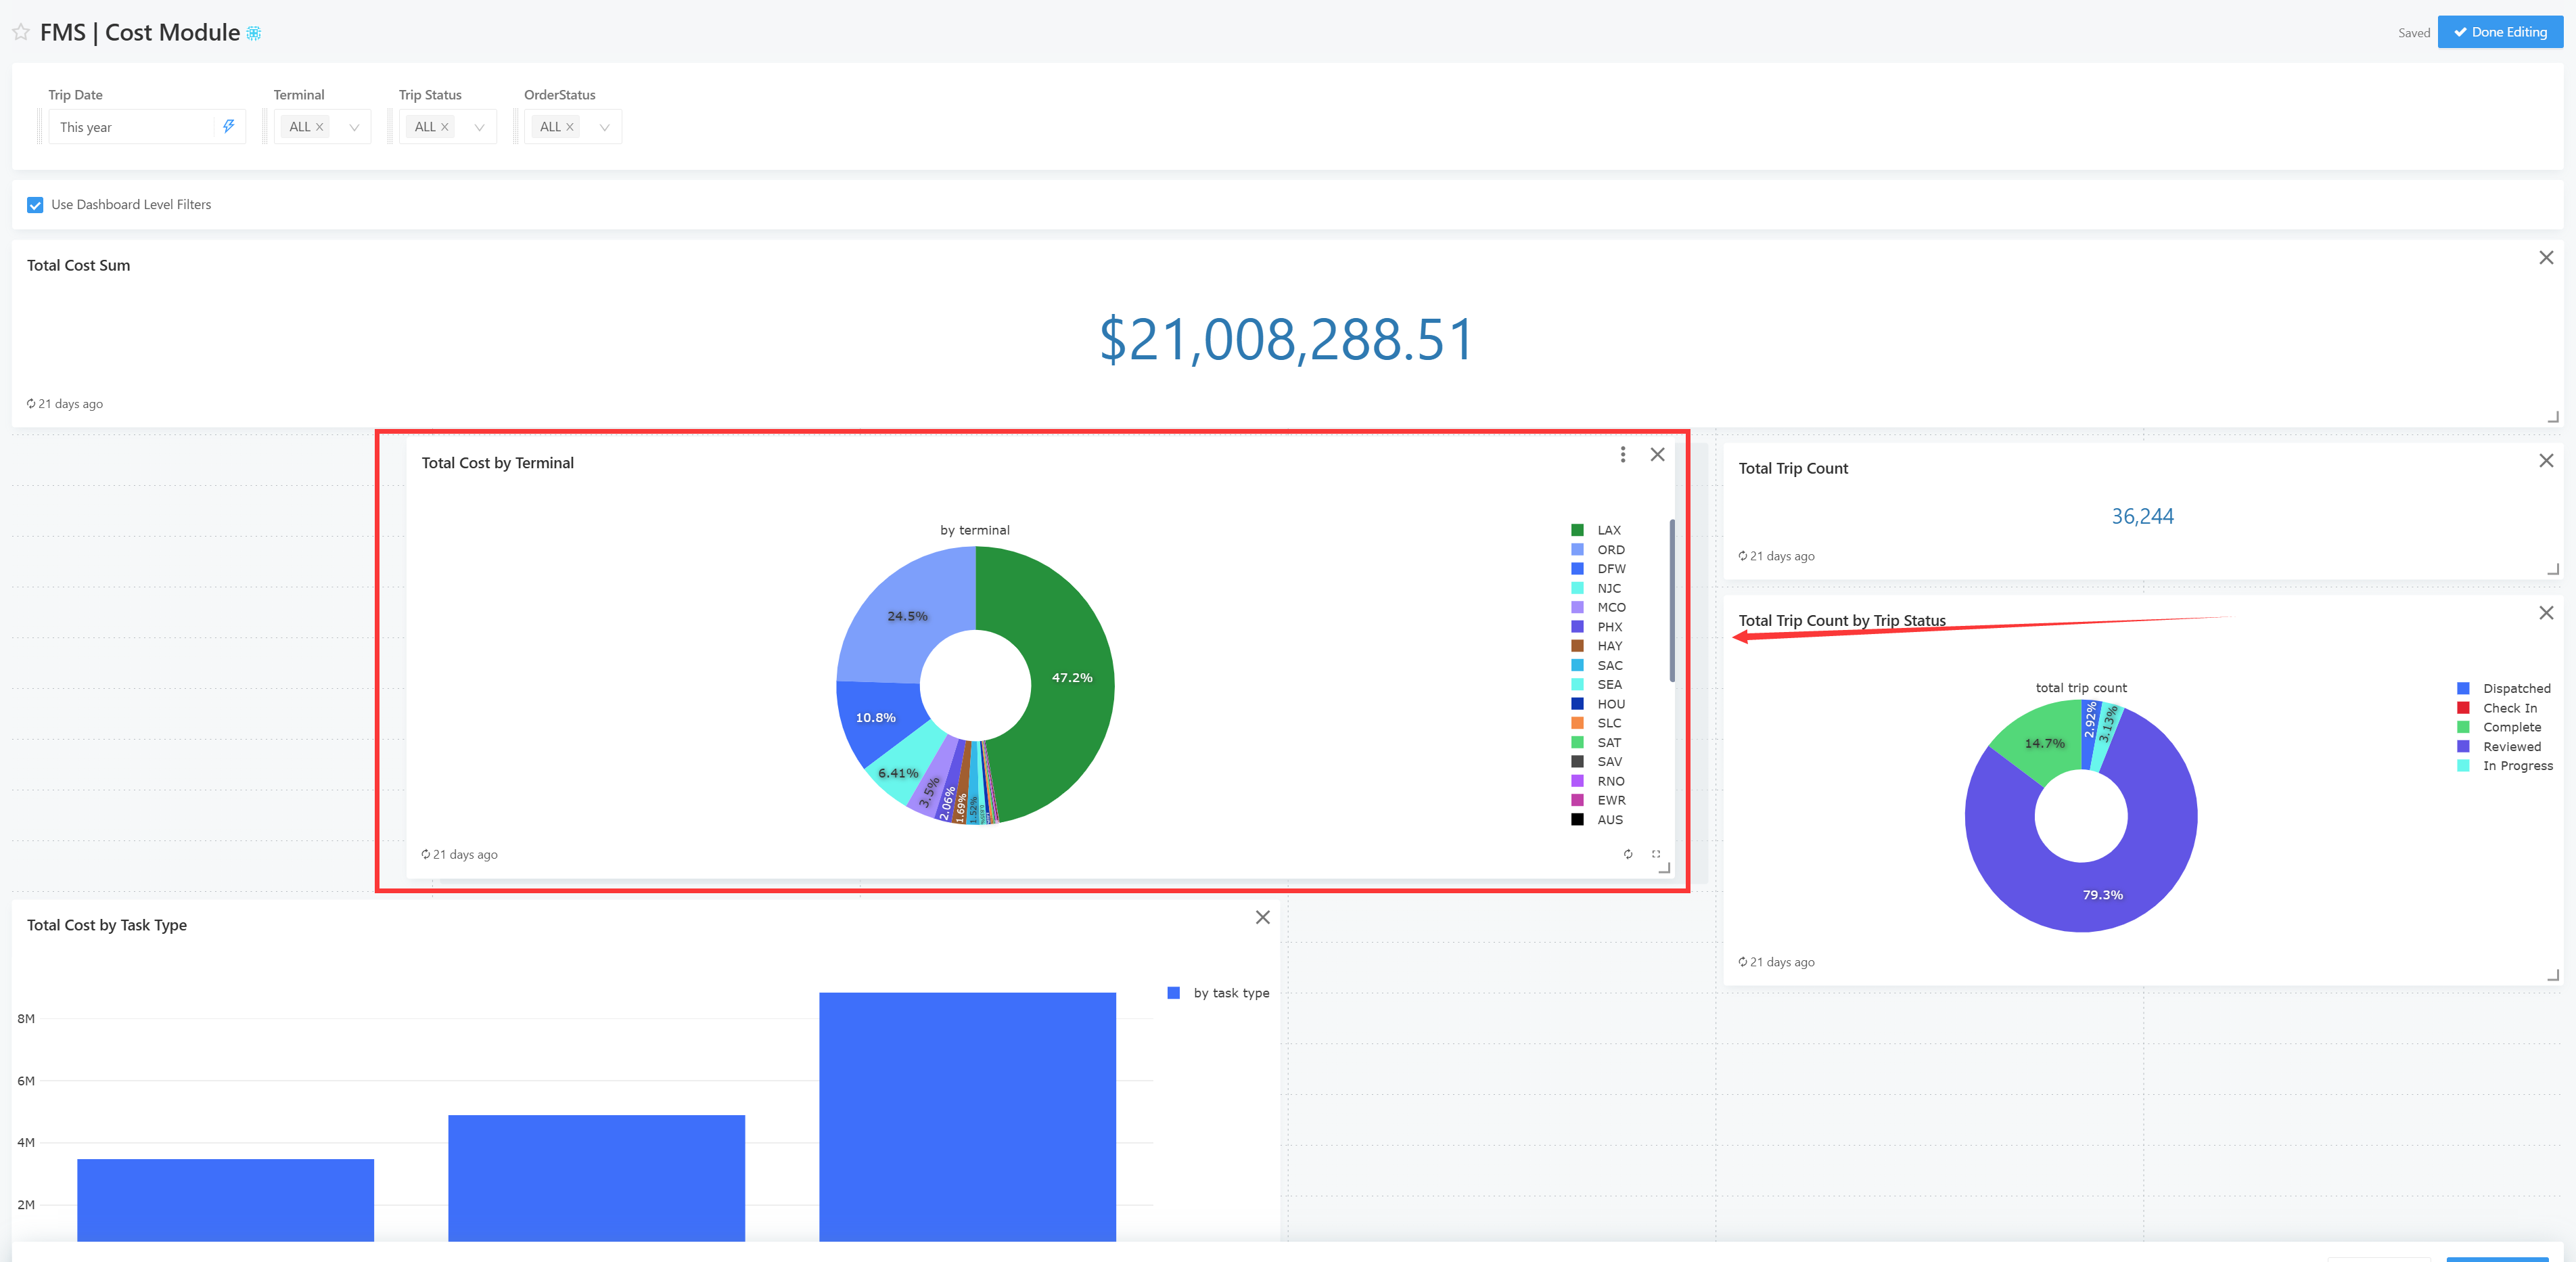
You can also click into a specific chart for further editing

You can adjust the SQL, change chart types, and more
Creating New Dashboards
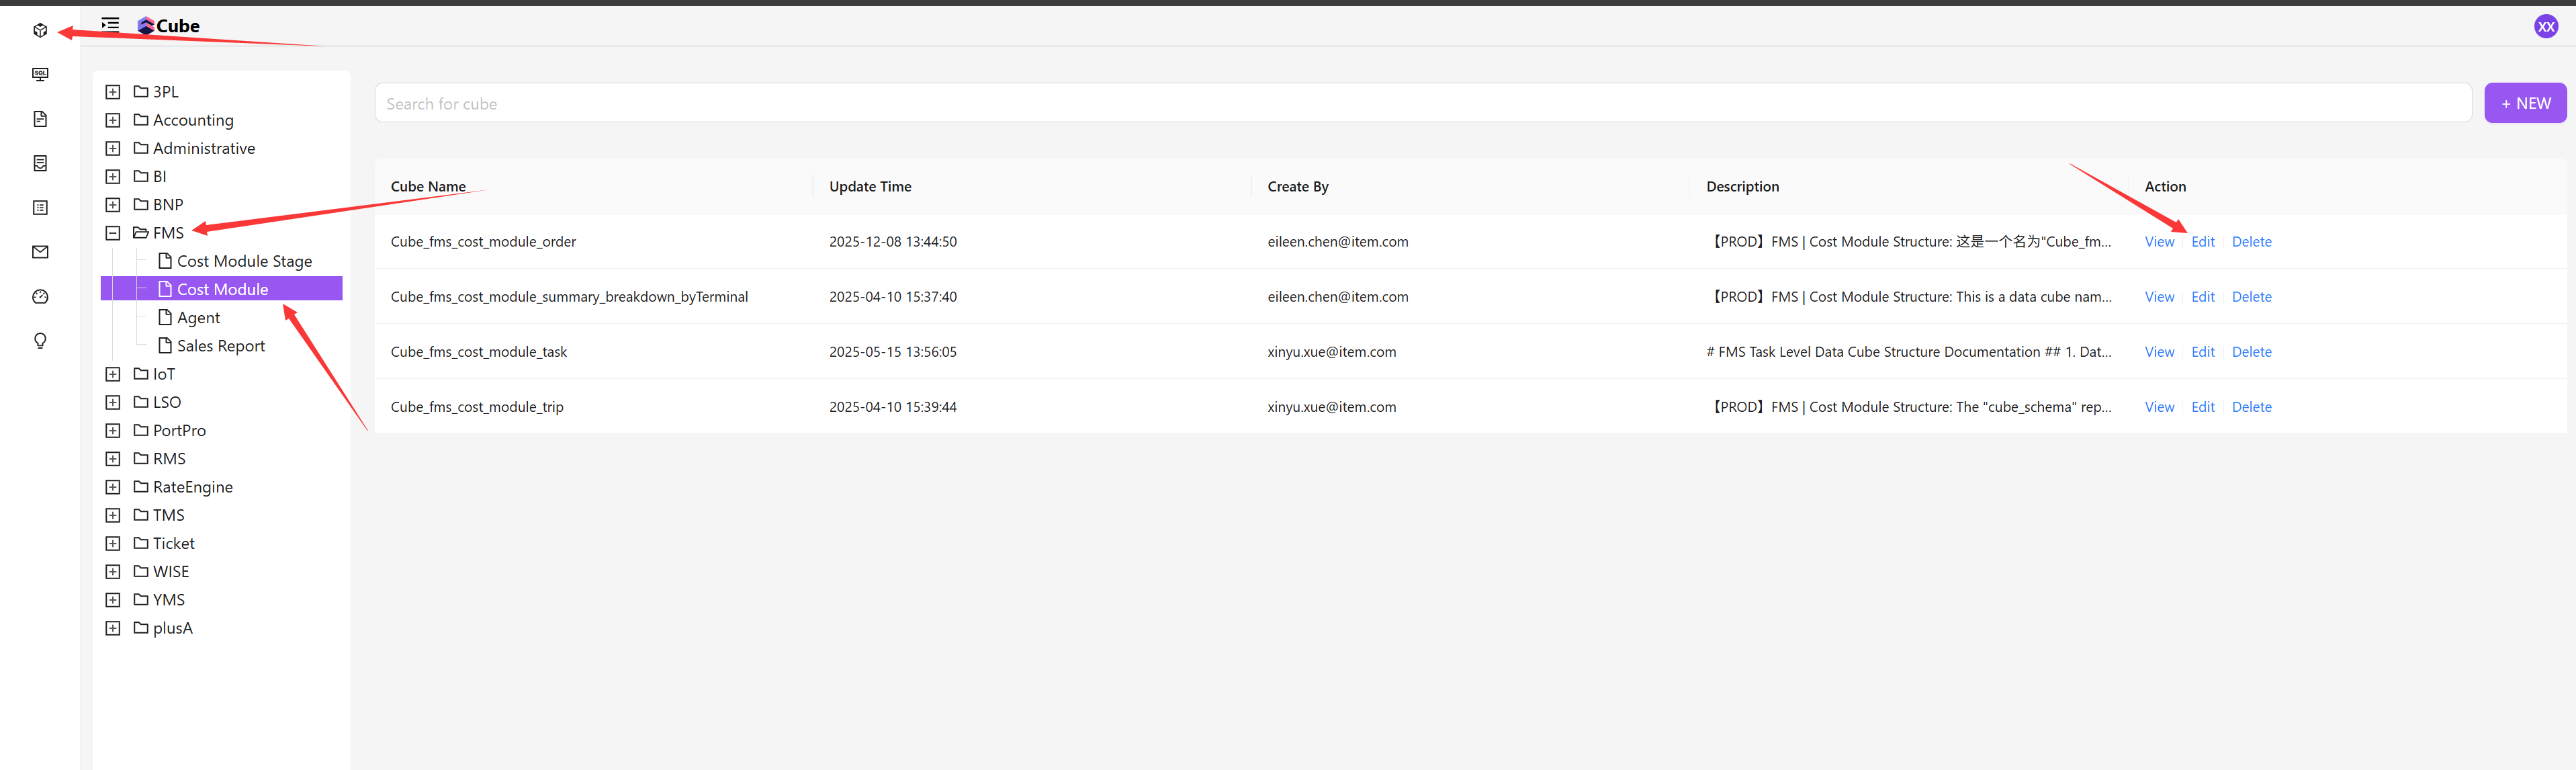
To create a new Dashboard, you must first create a Query; and to create a Query, you need to access Cube
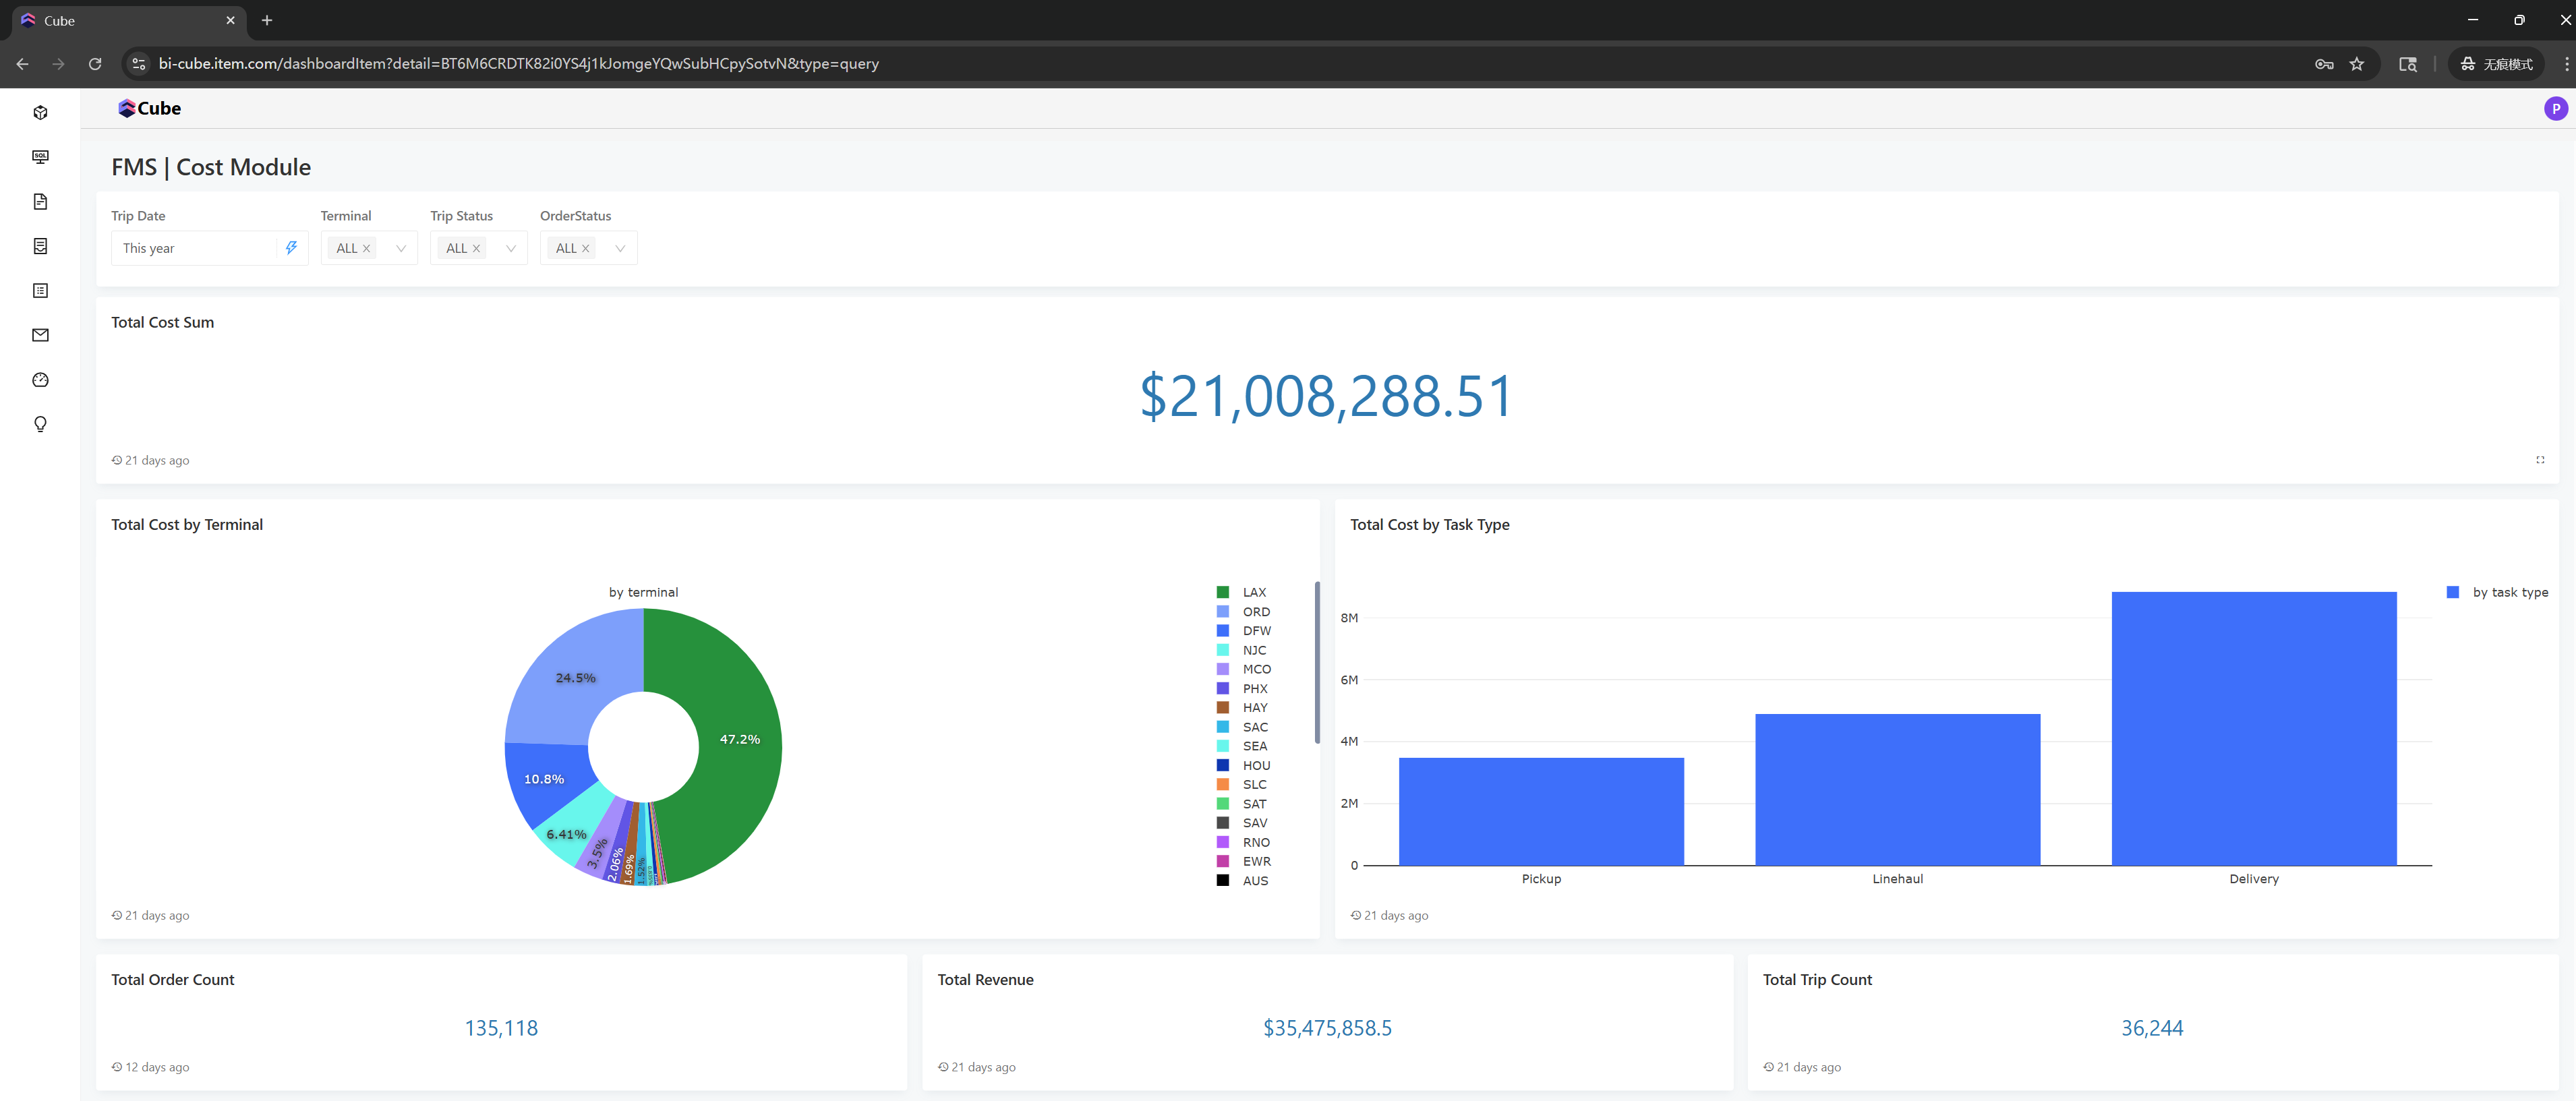
Continuing with the FMS Cost Module example, click View to enter the Cube
Select the filter conditions, dimensions, and measures you want to view, and the page will display the relevant data
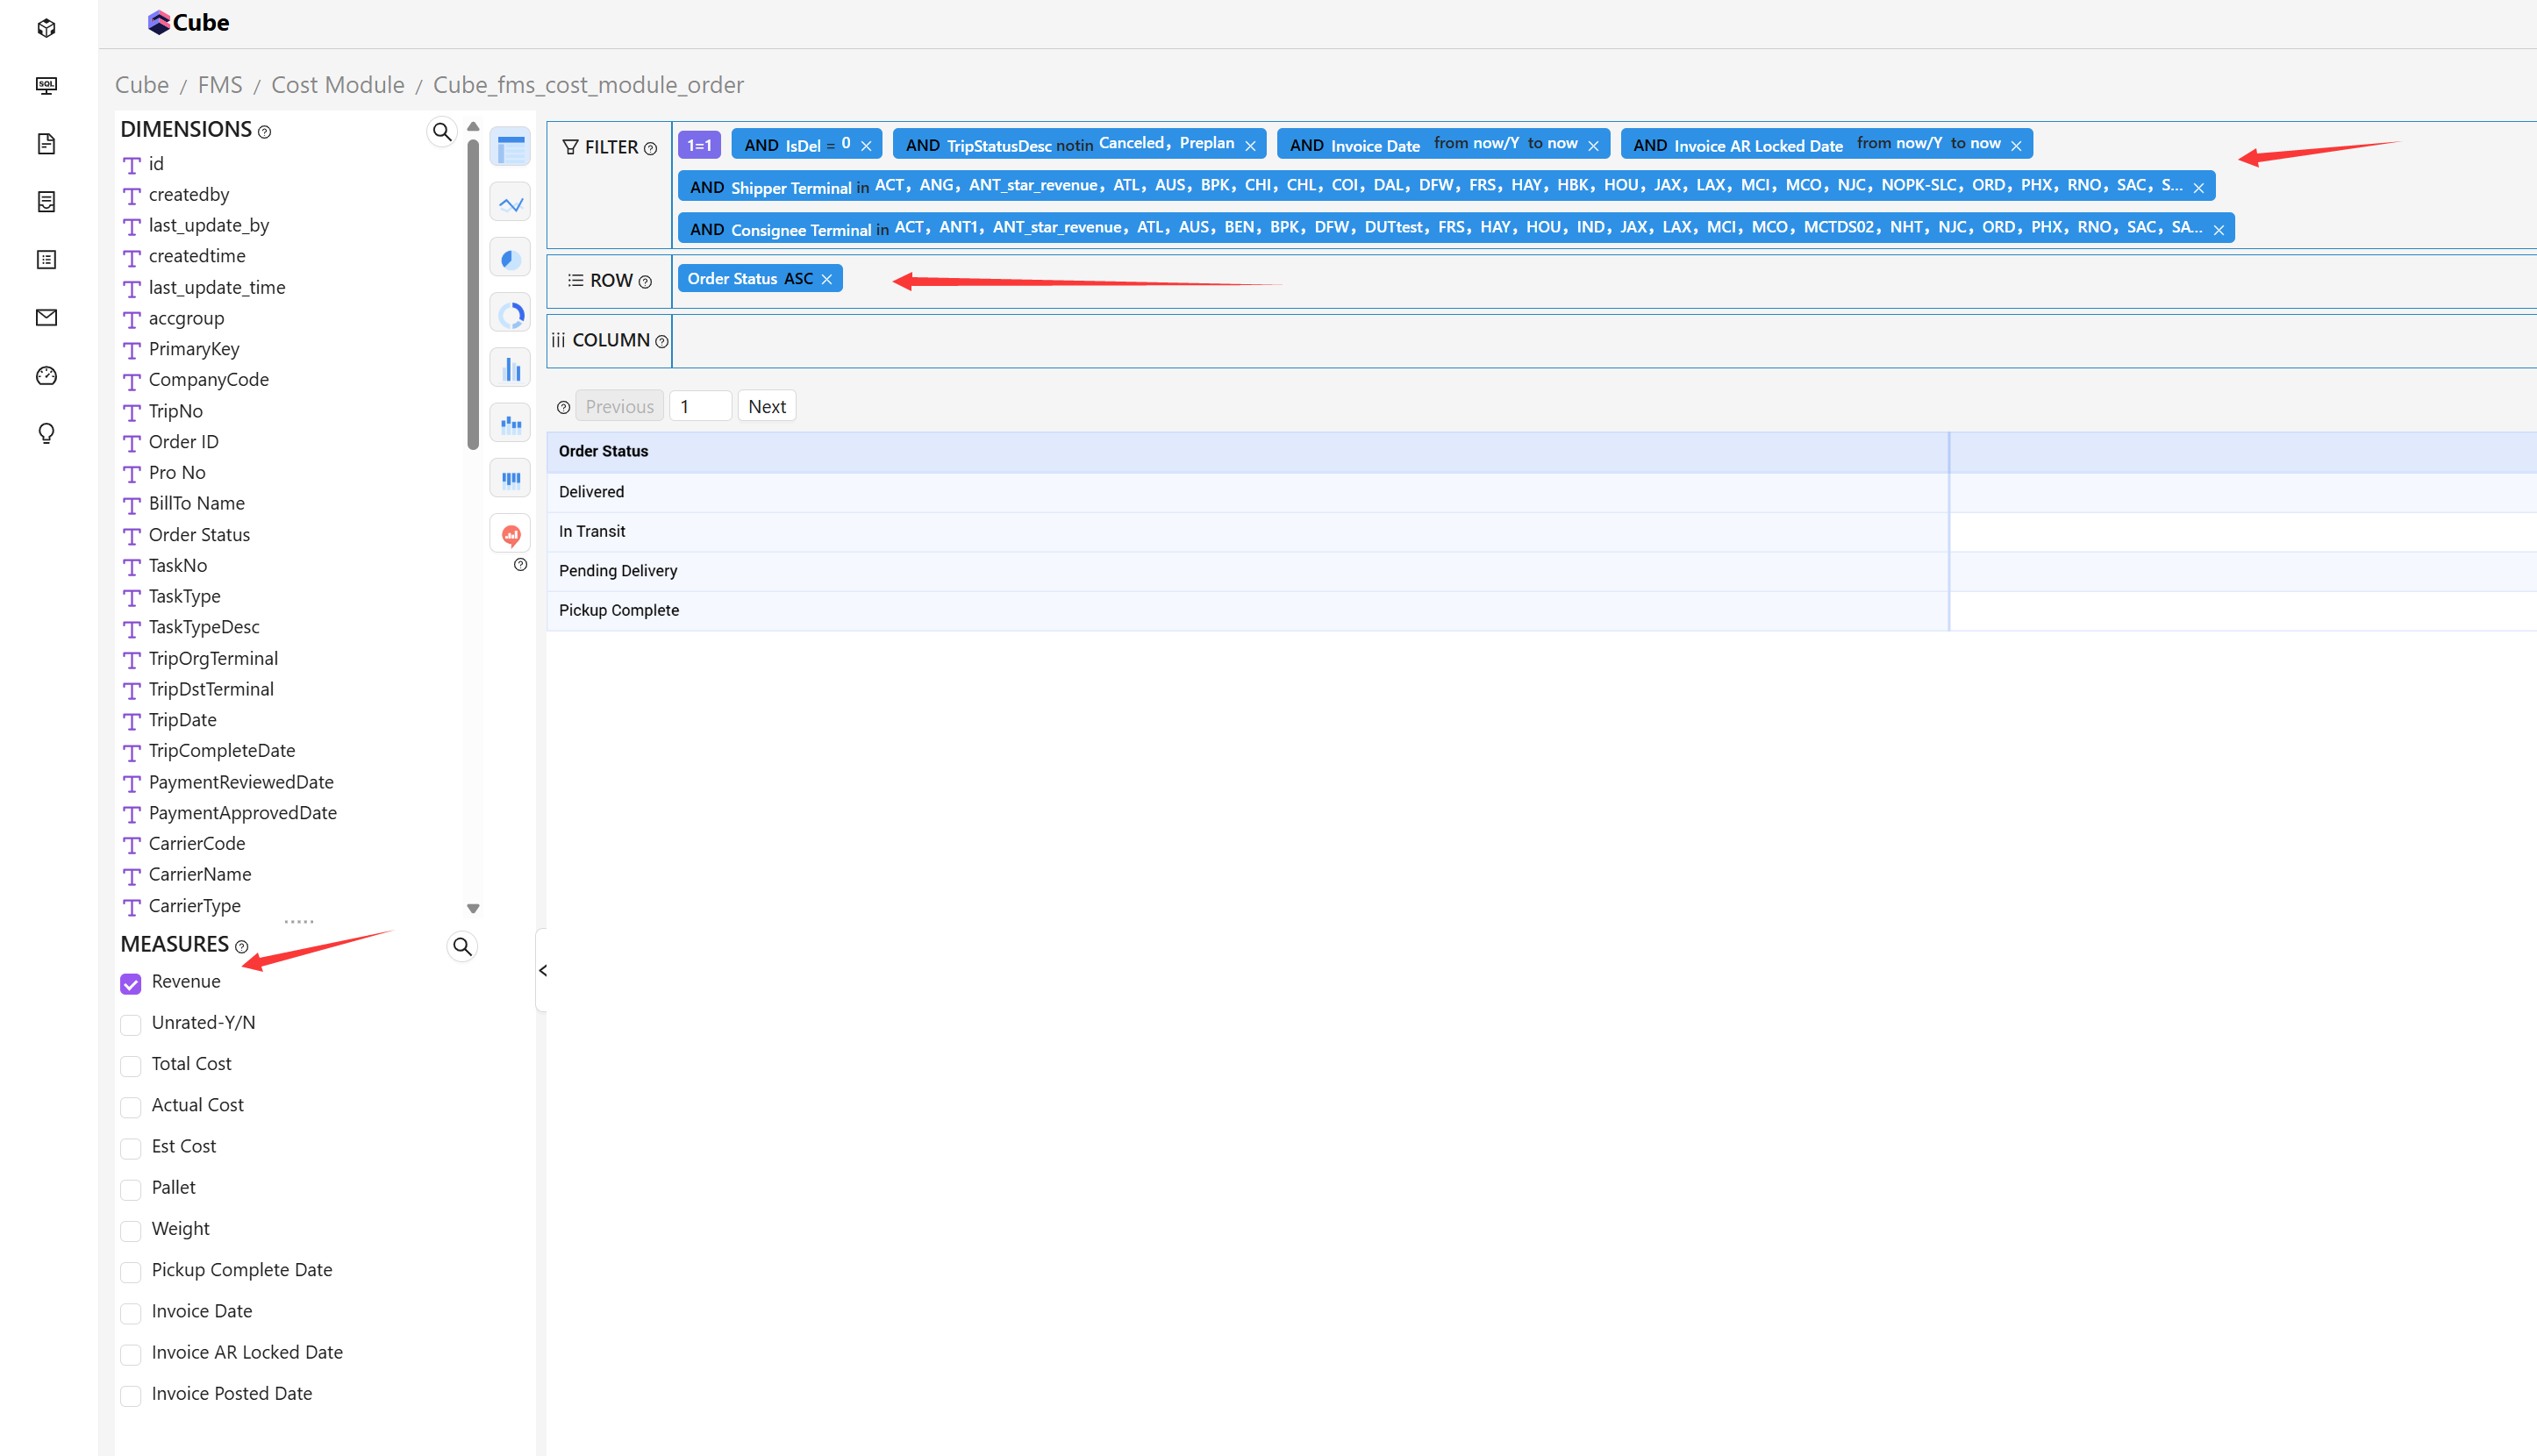
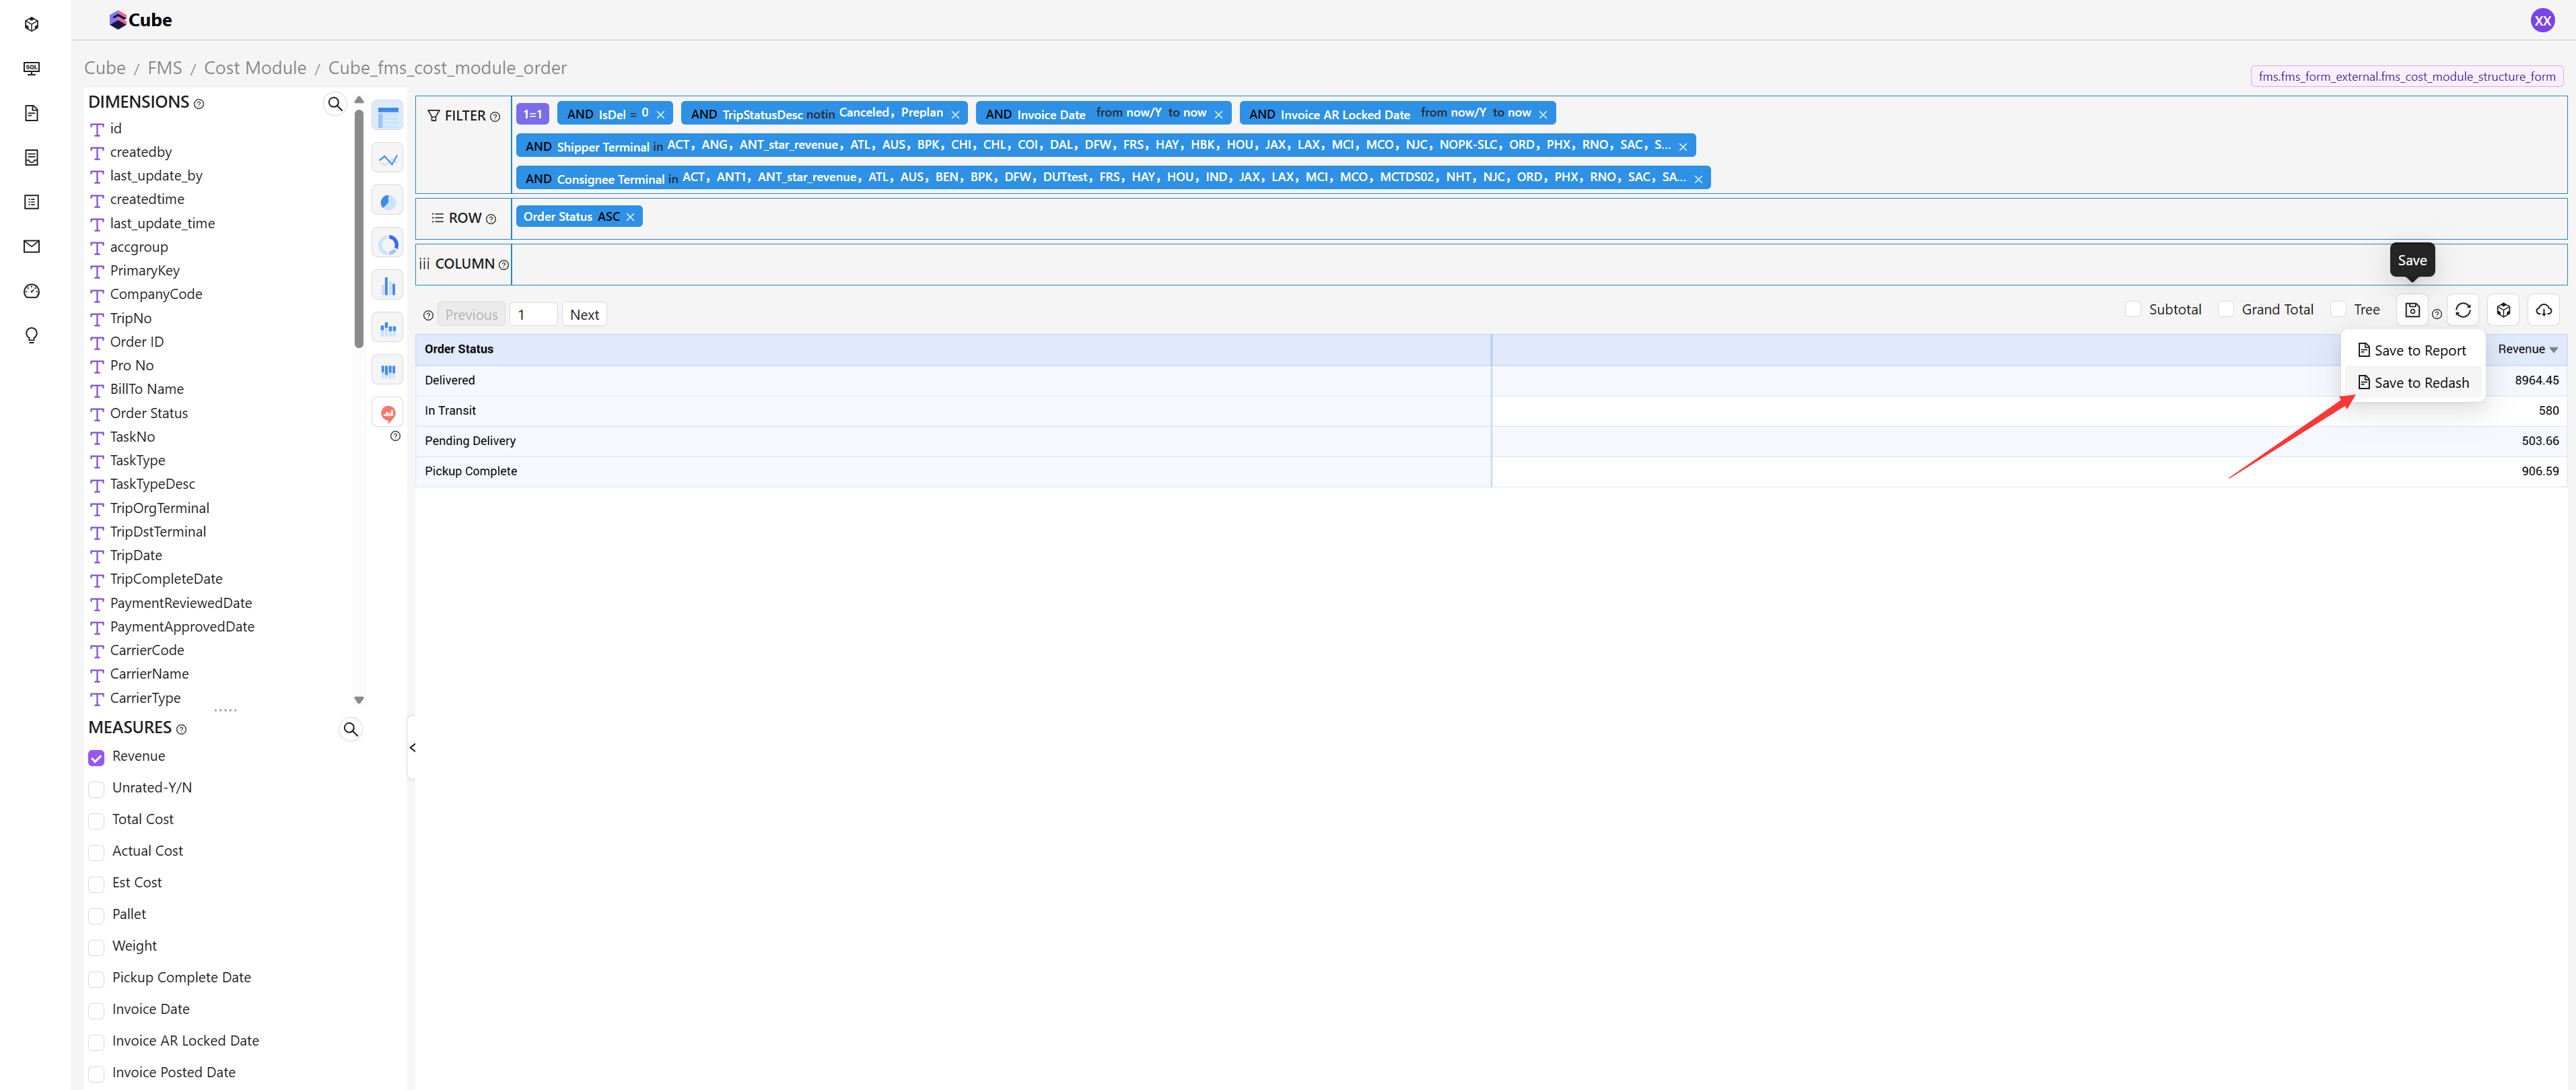
Click Save to Redash on the right side
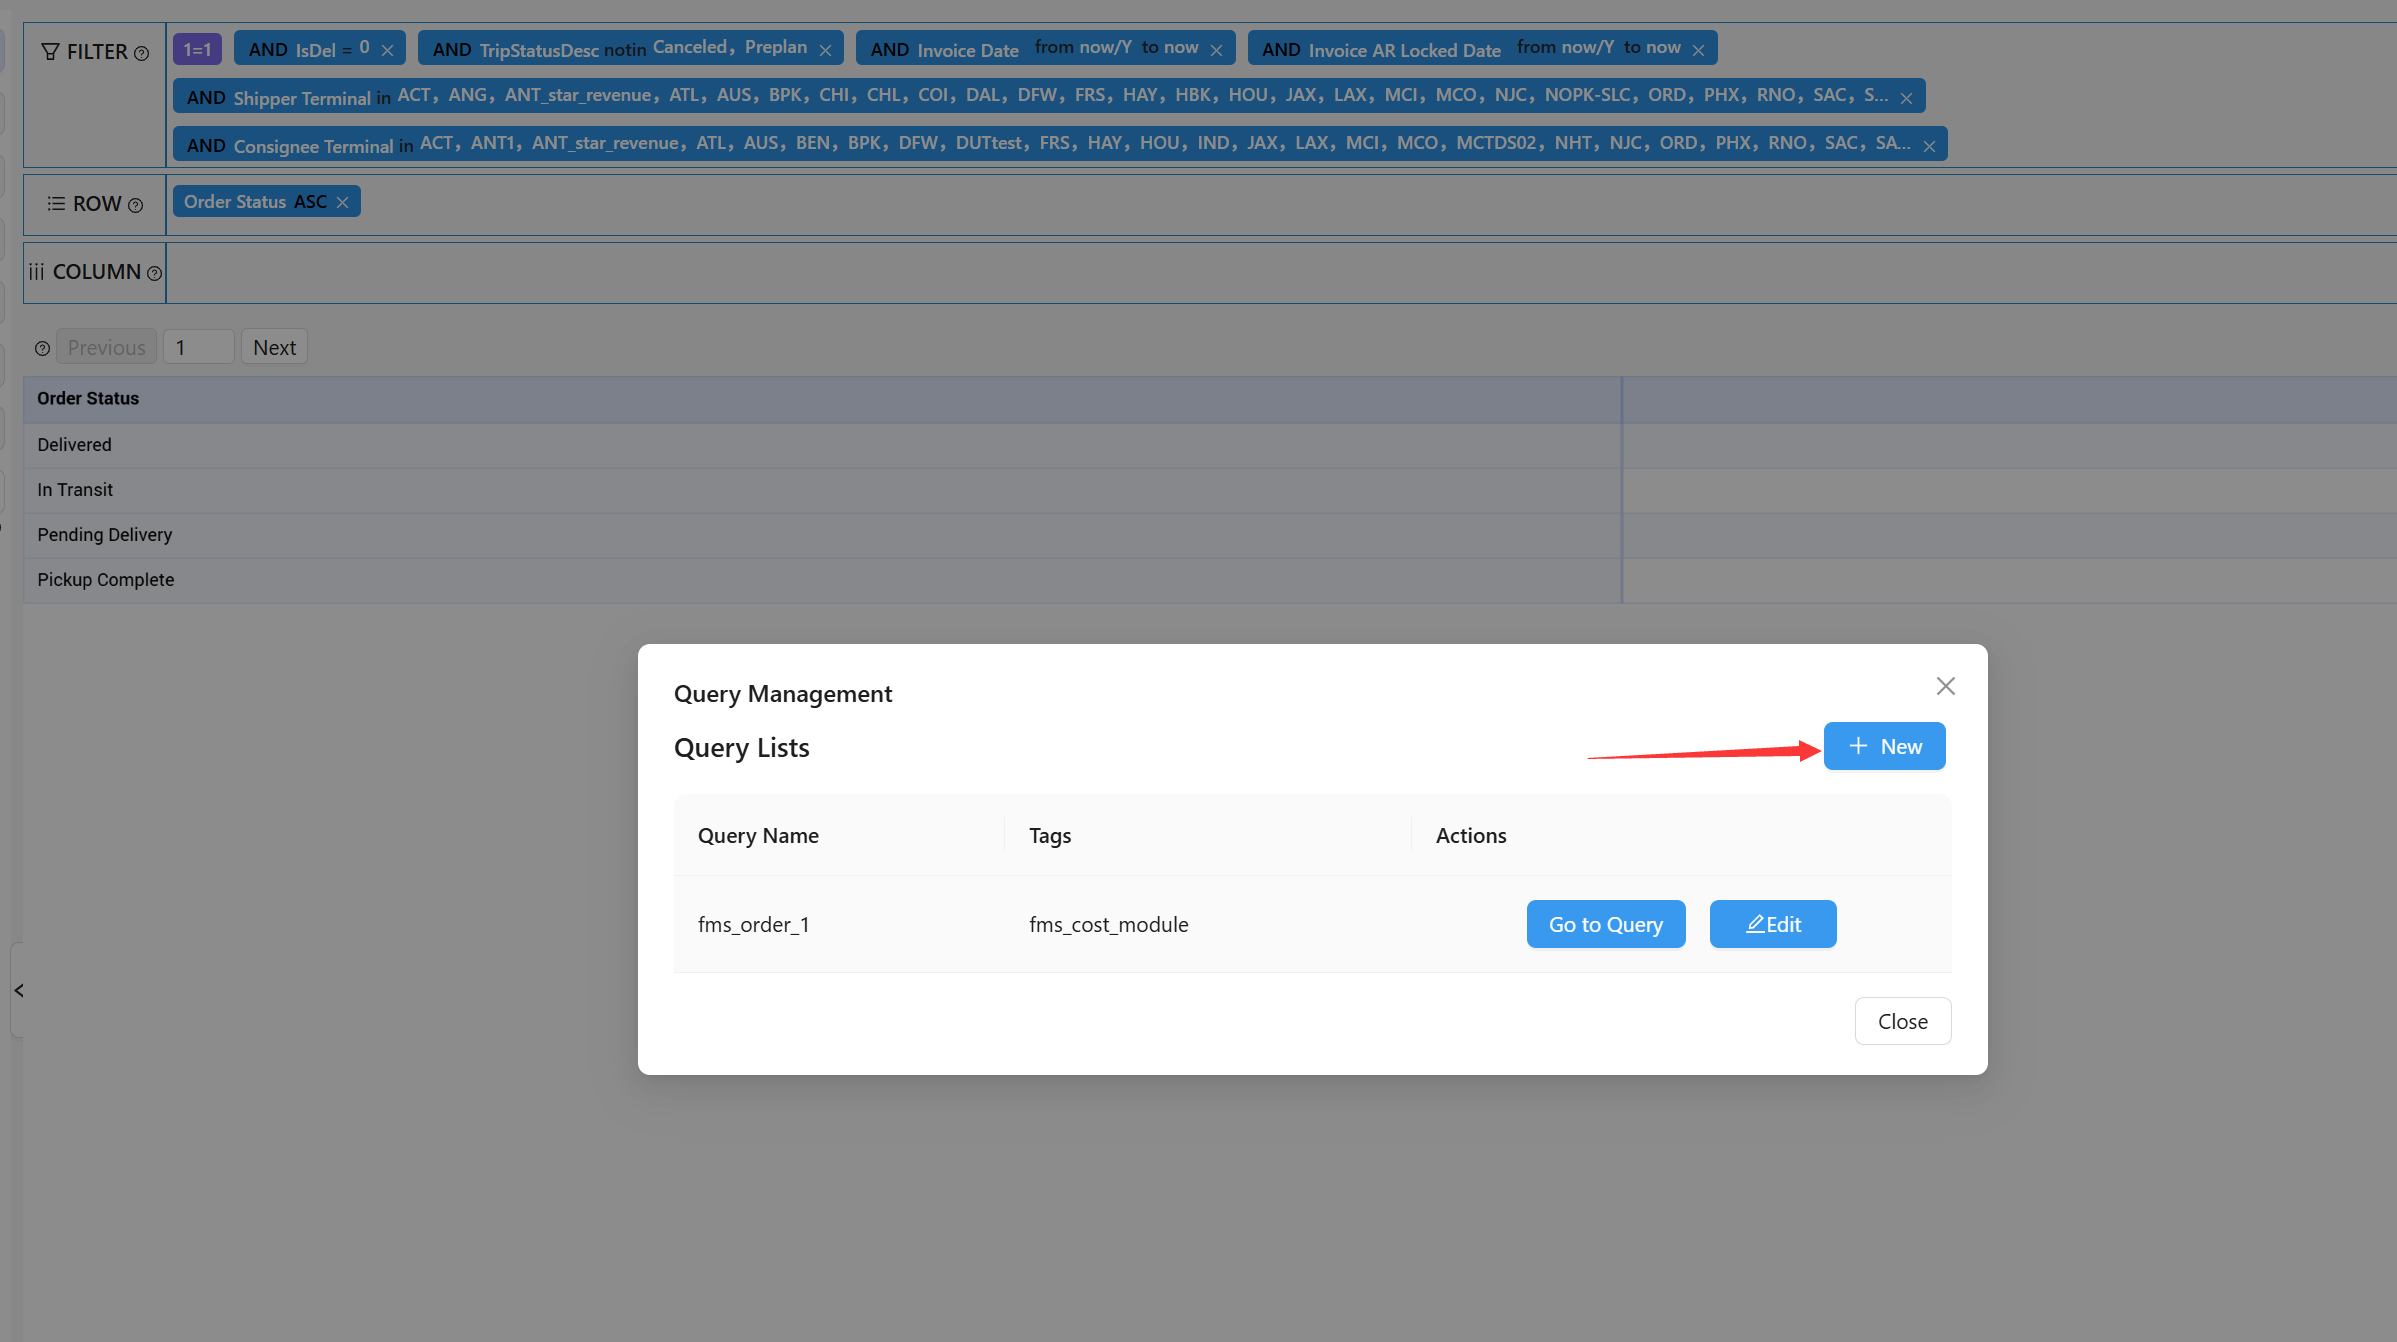
Continue by clicking New
Give the Query an appropriate name and select suitable tags (based on business scope)
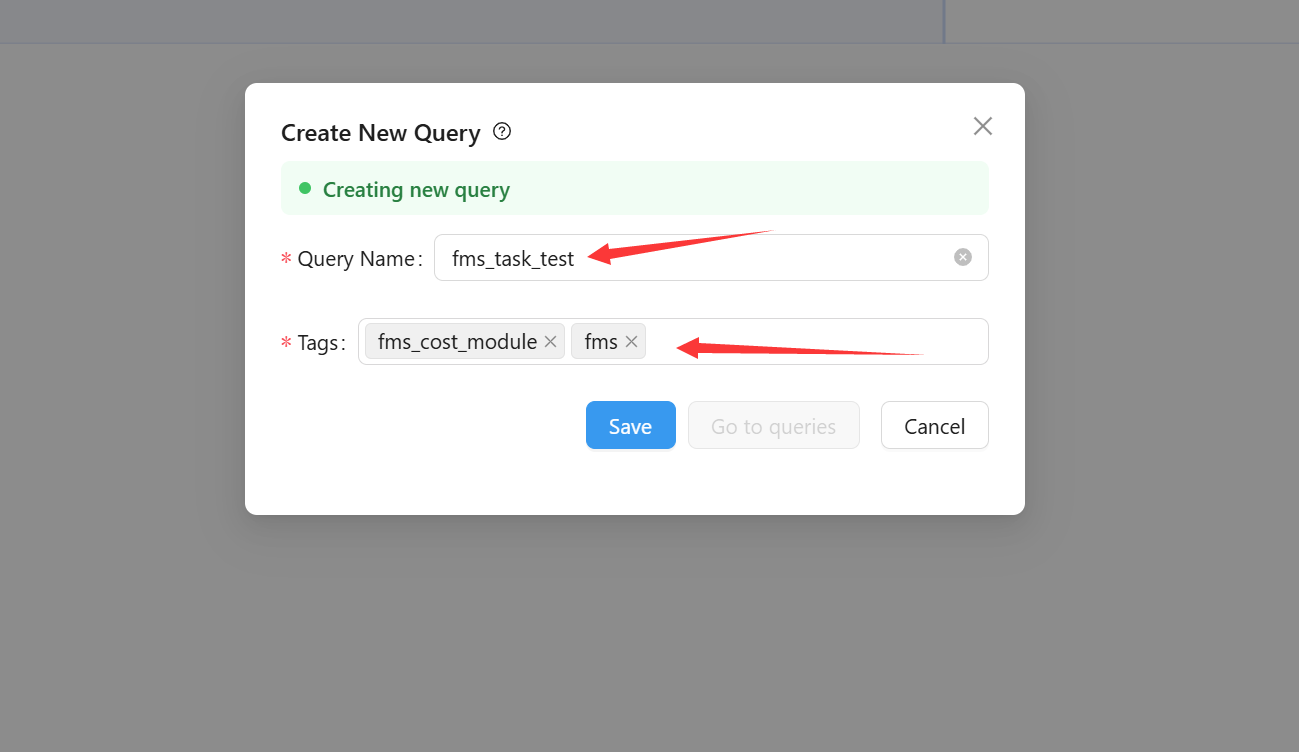
After successful saving, you can proceed to view it

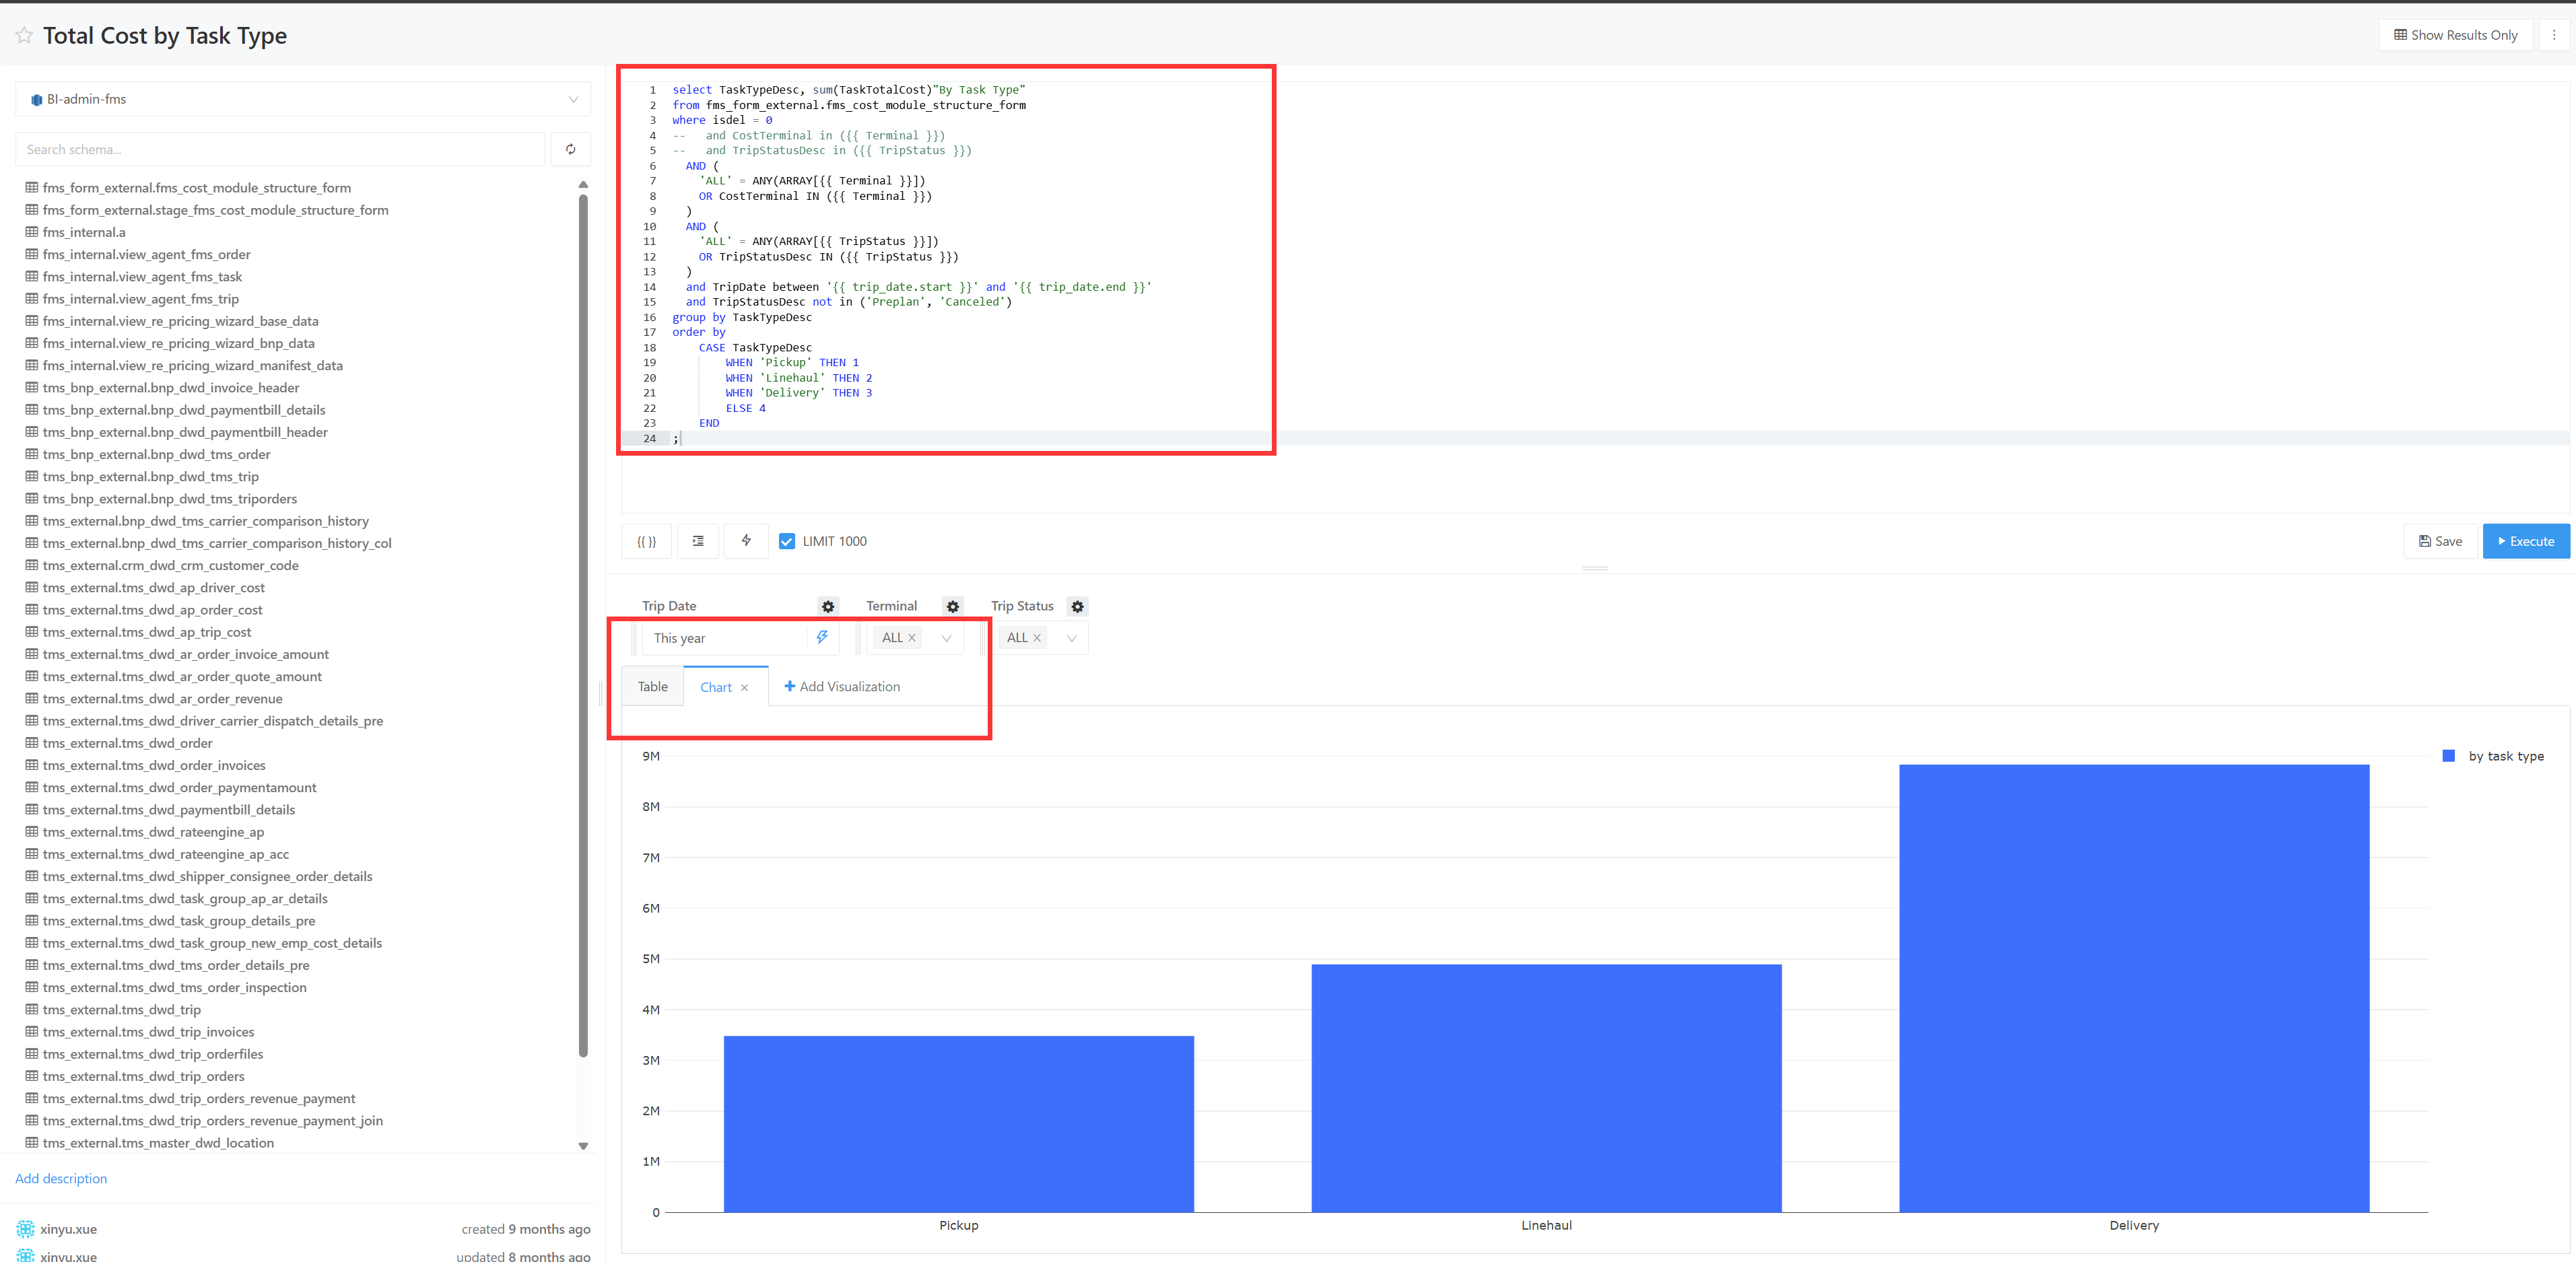
You can edit the SQL to obtain data that meets your expectations, click Execute to run the query, and click Save after confirming everything is correct

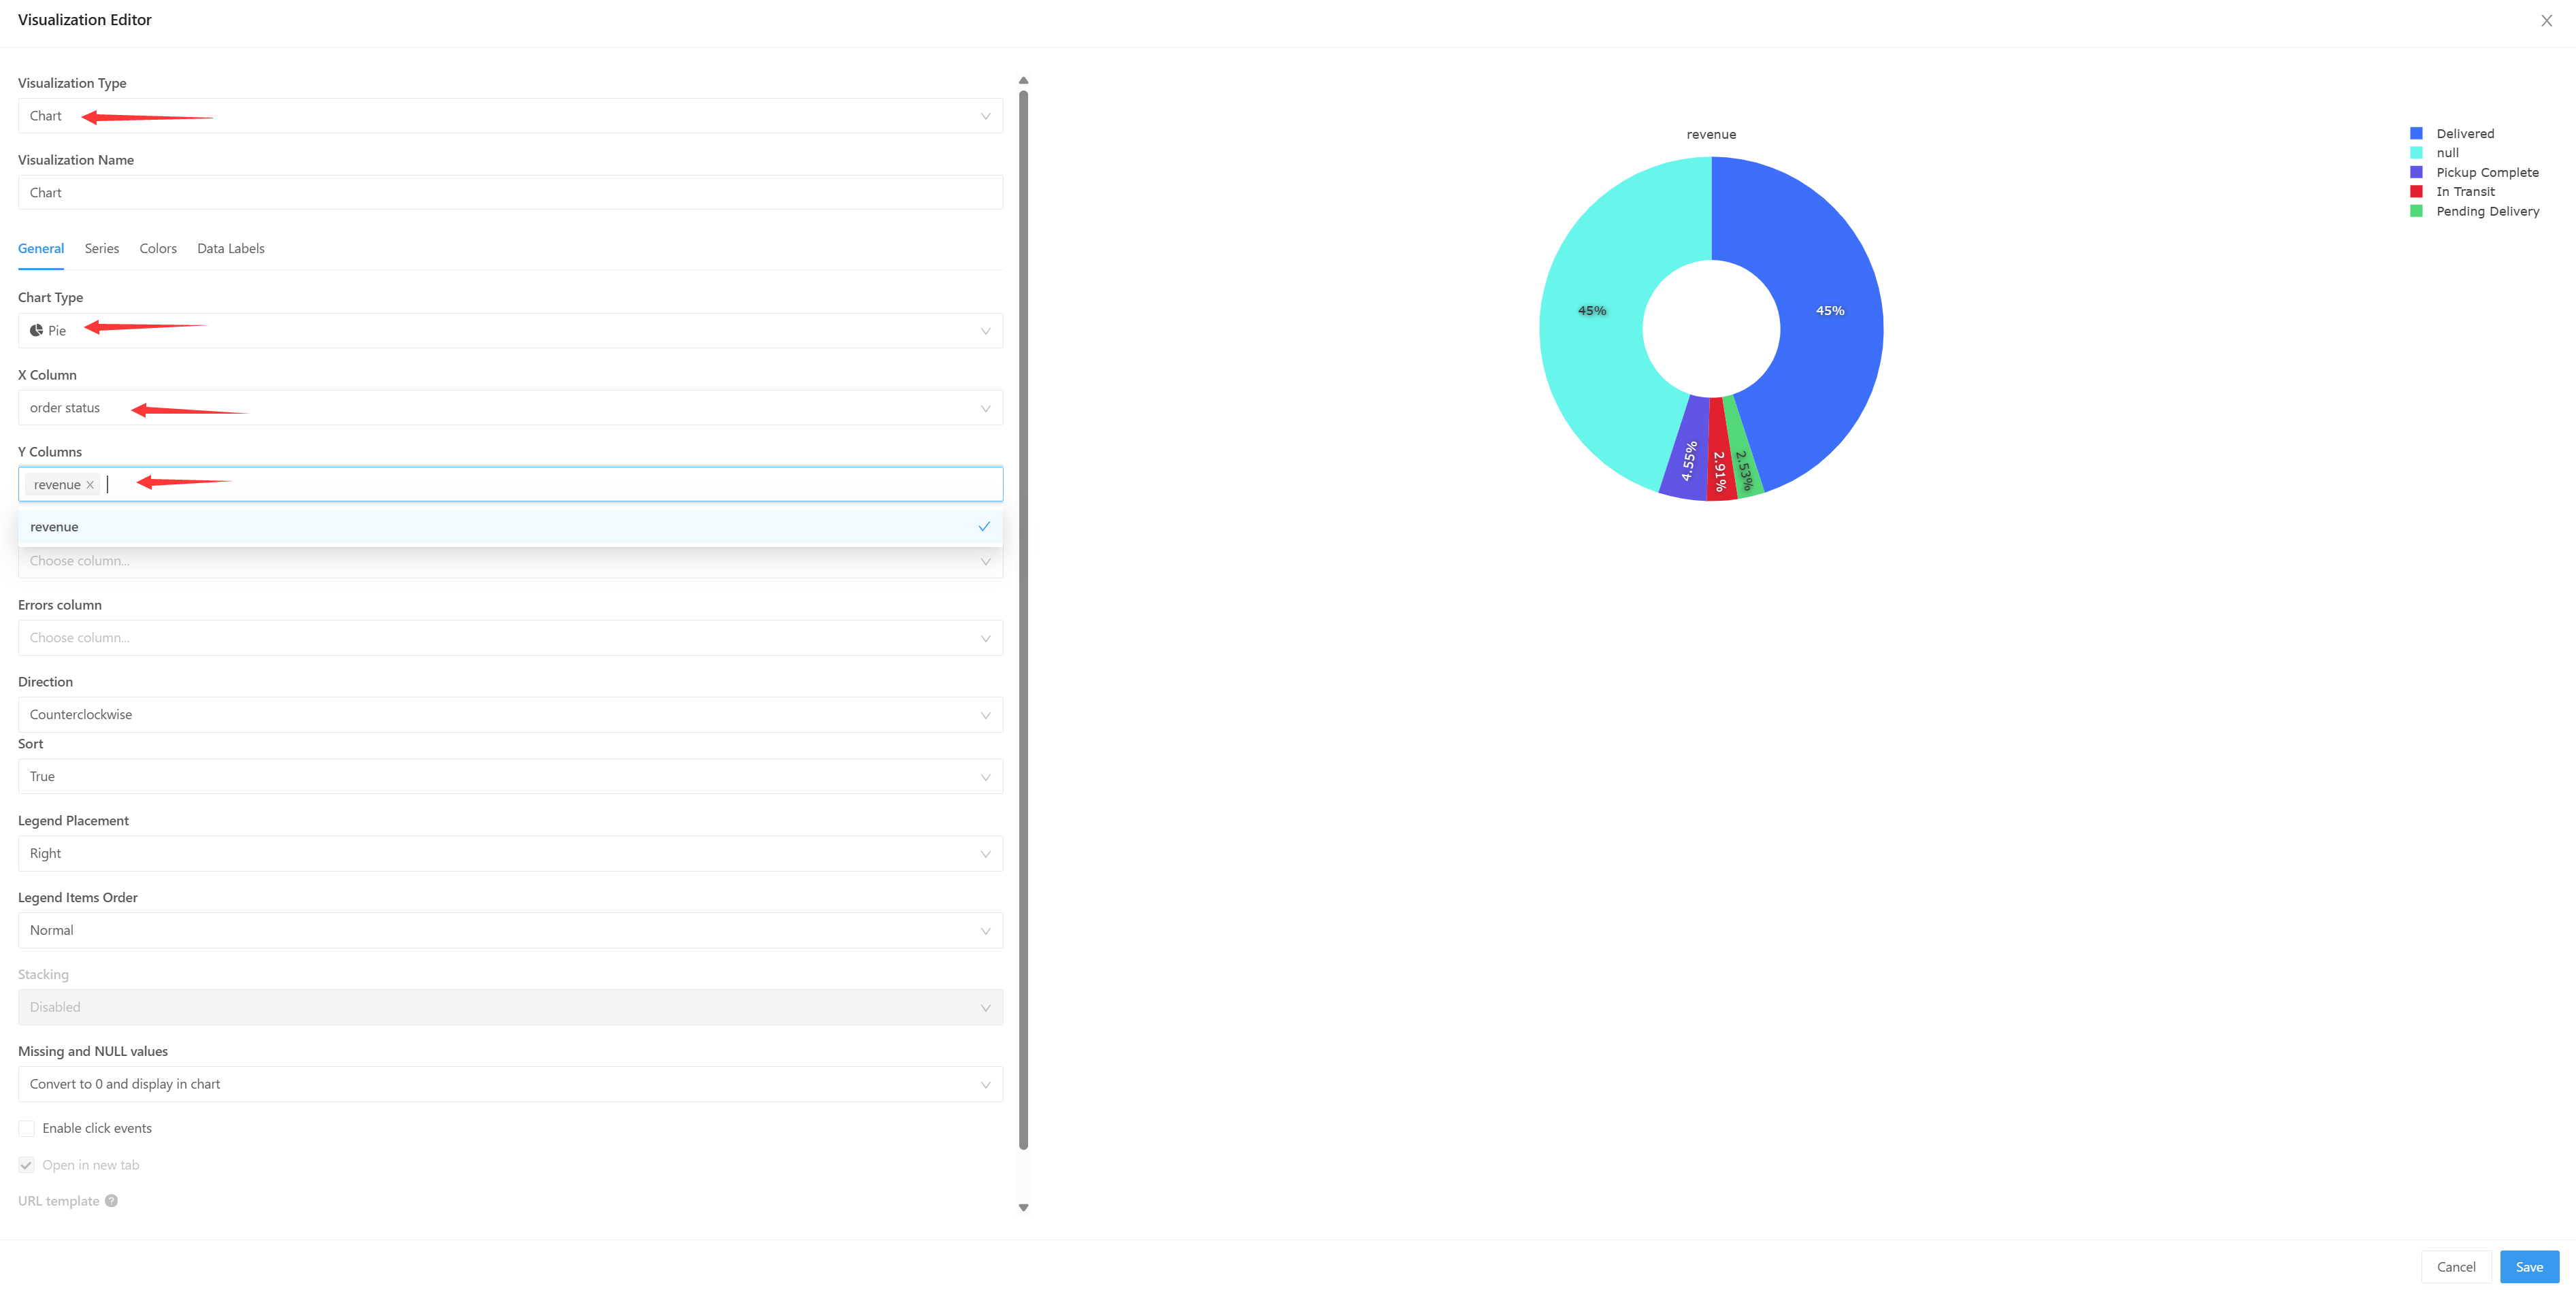
Add a visualization to the query
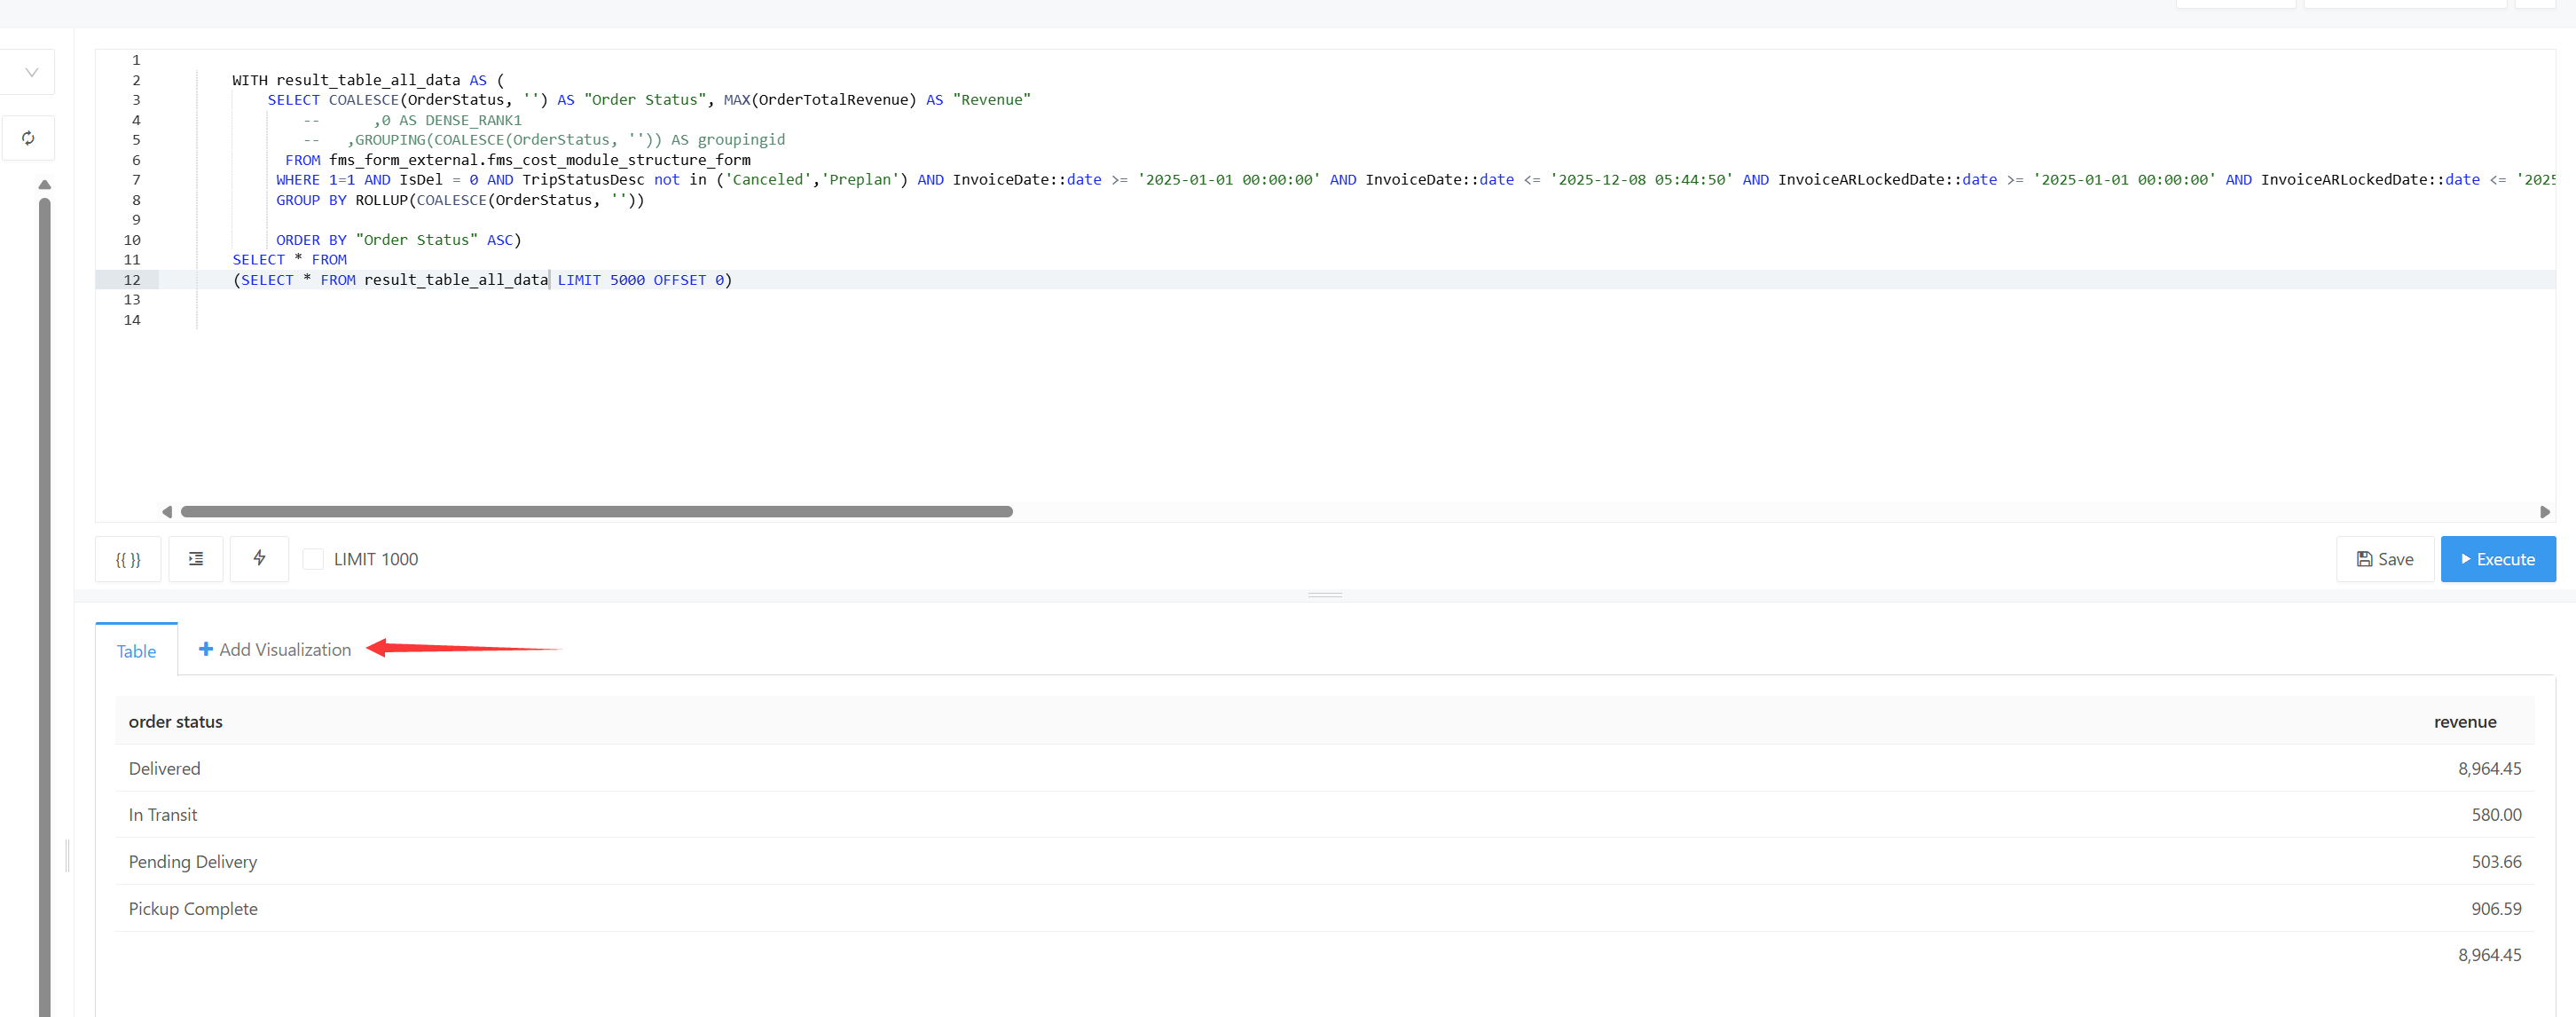
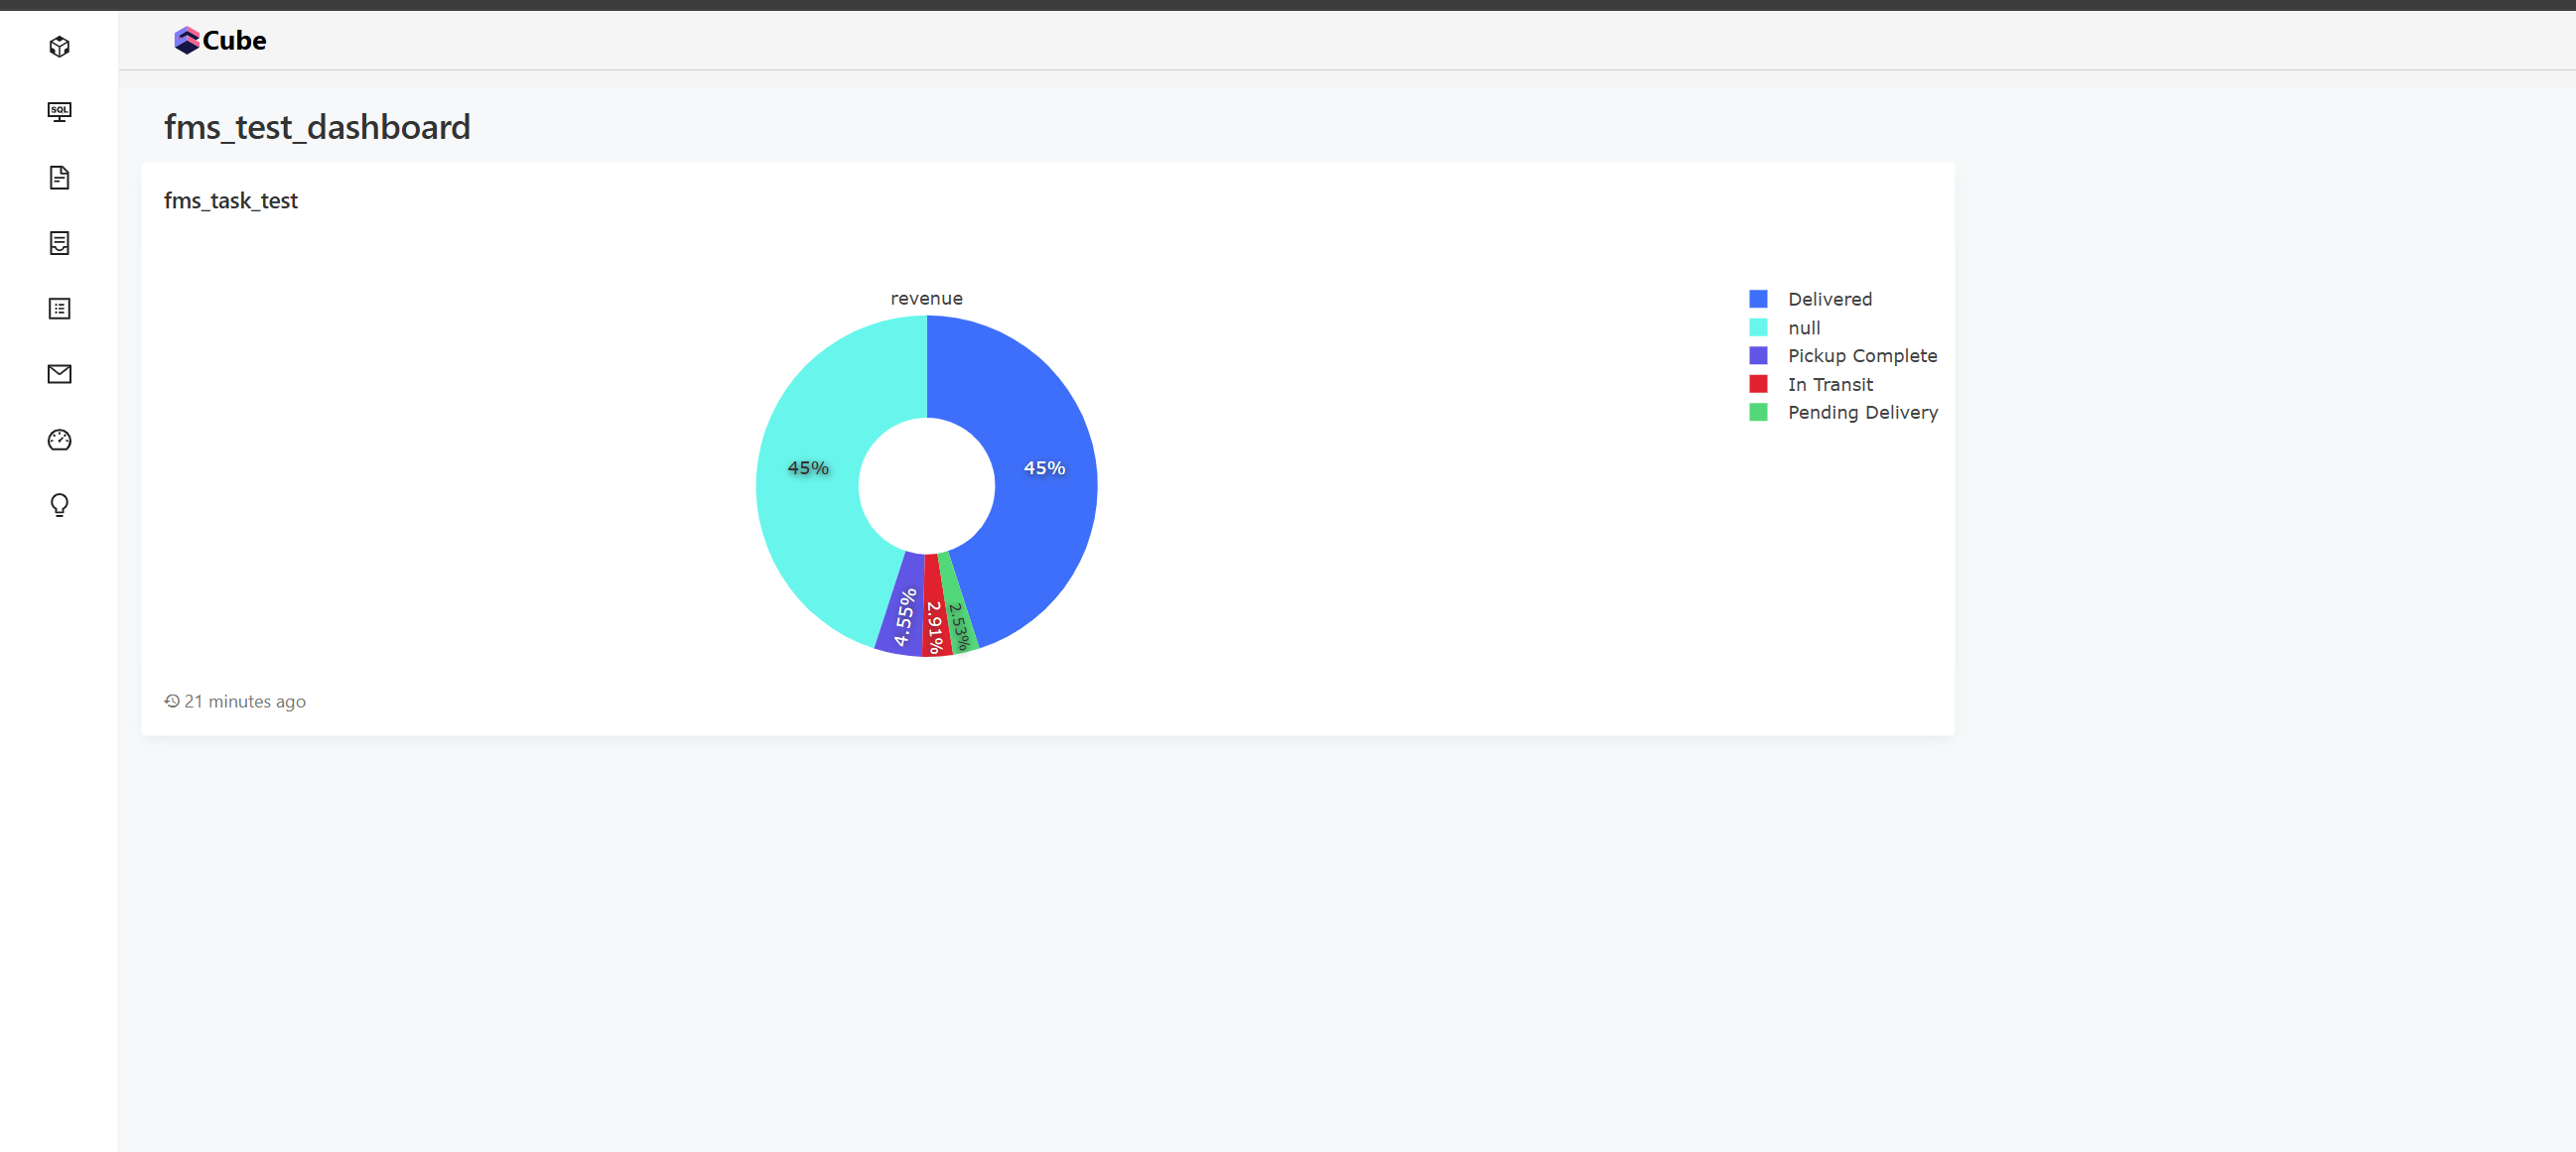
Select an appropriate chart type based on the data content. For example, order status is well-suited for a pie chart
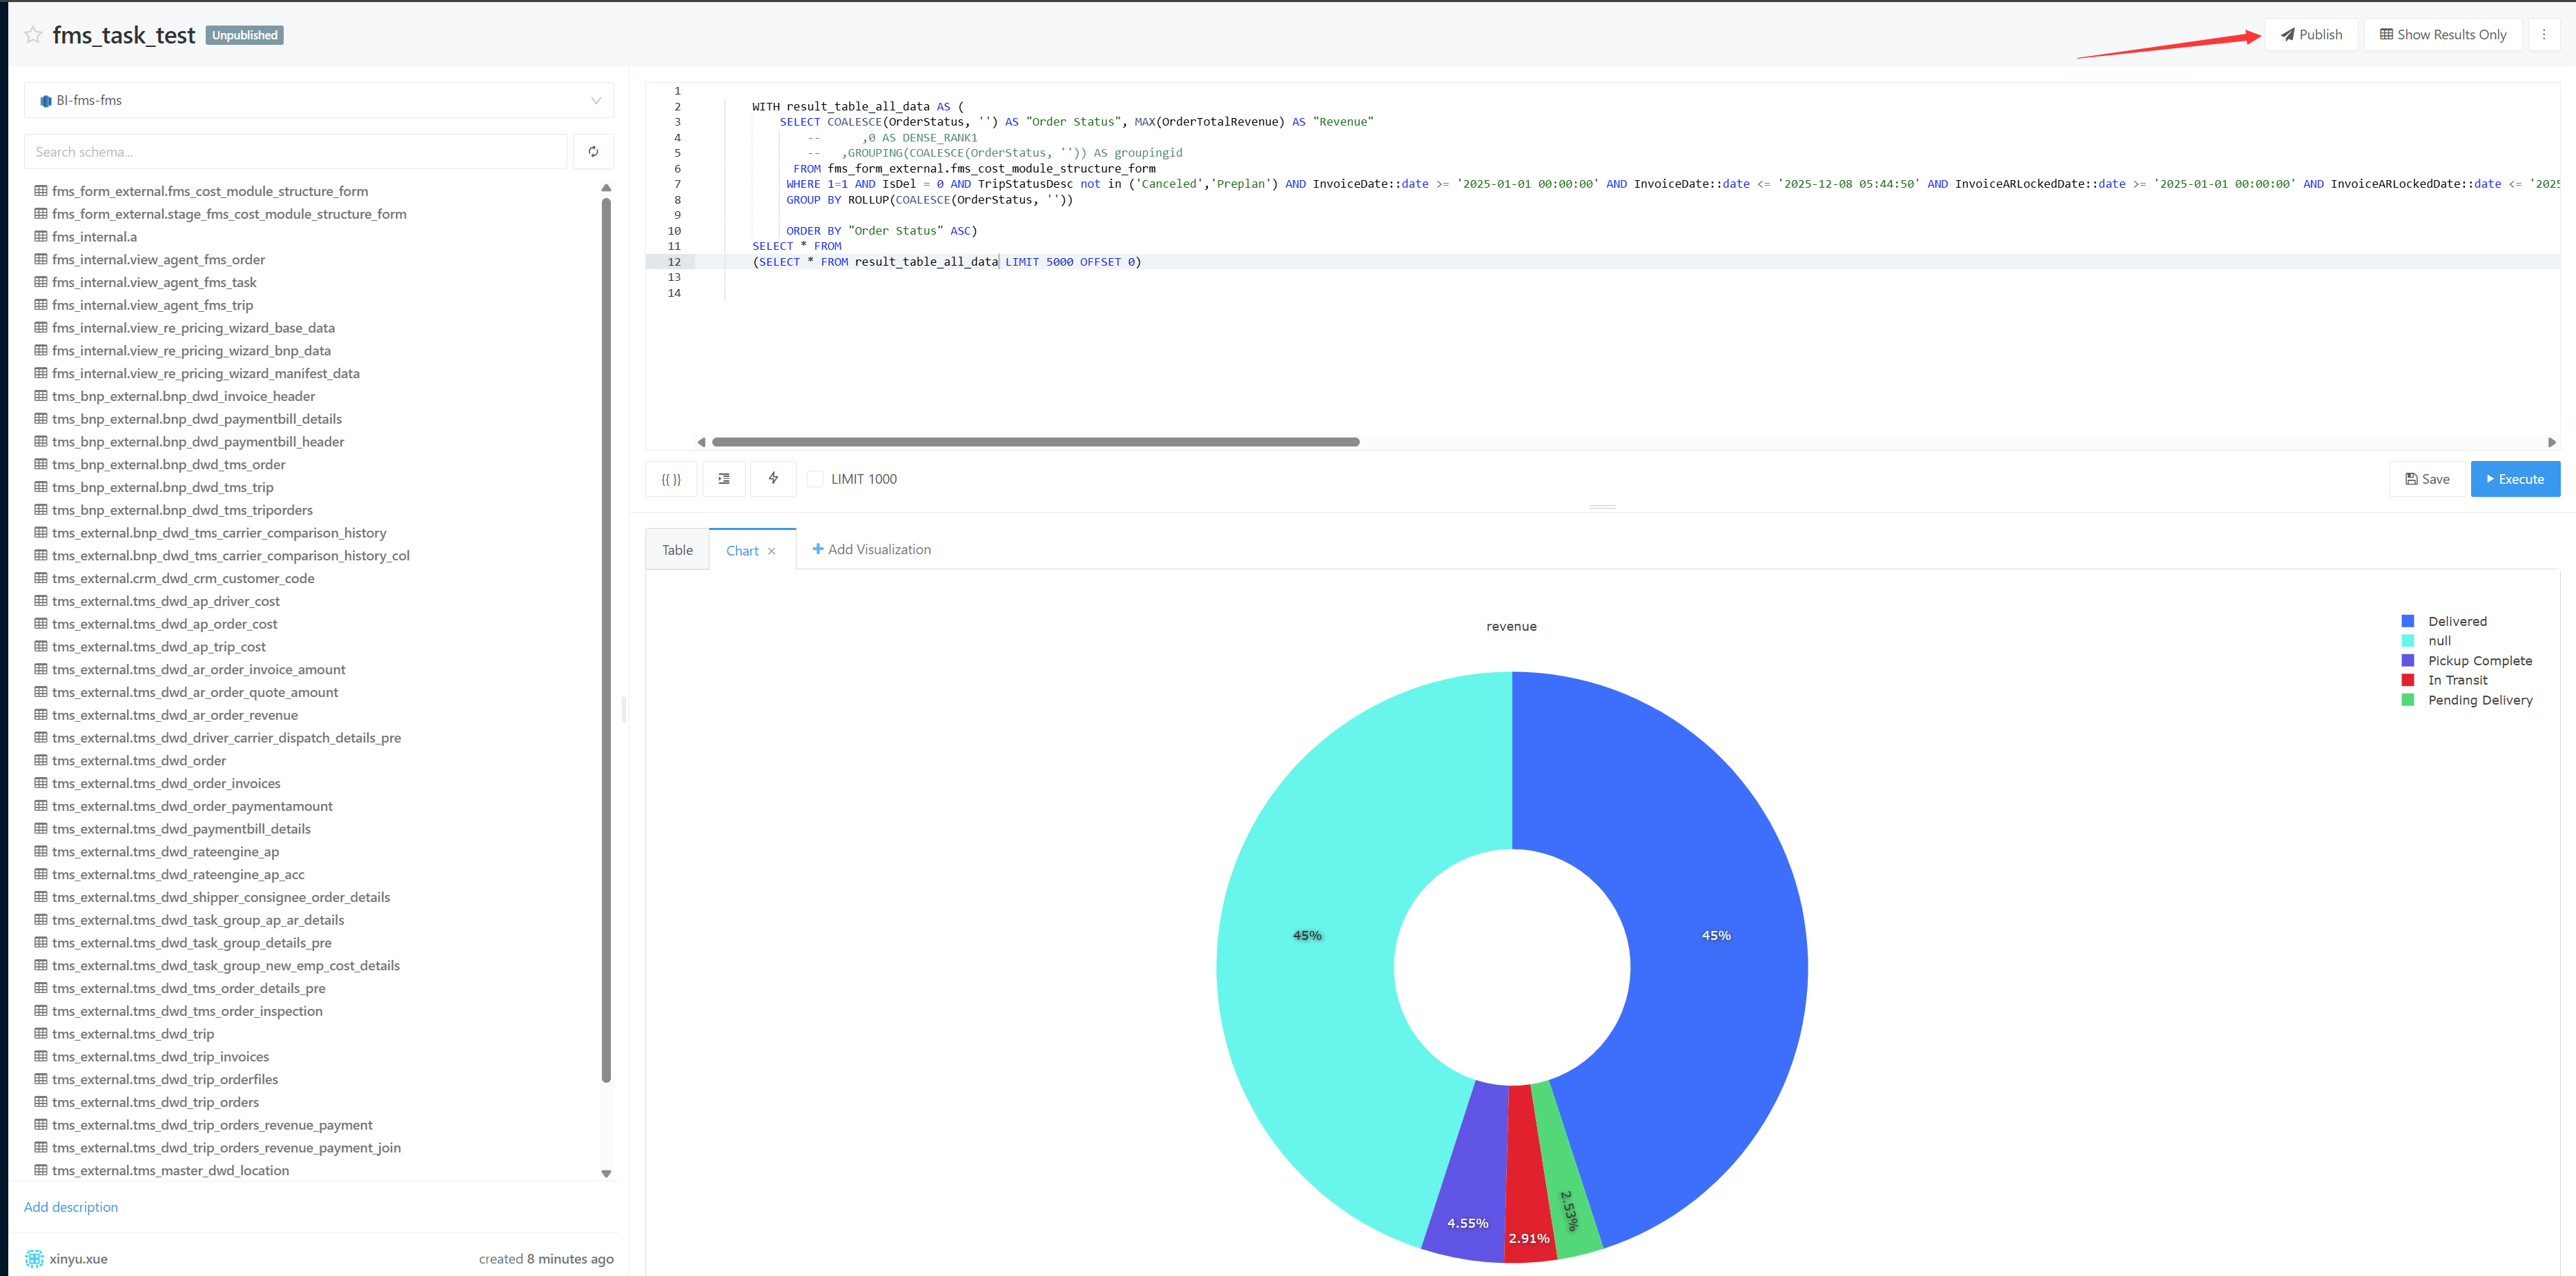
Return to the page to publish
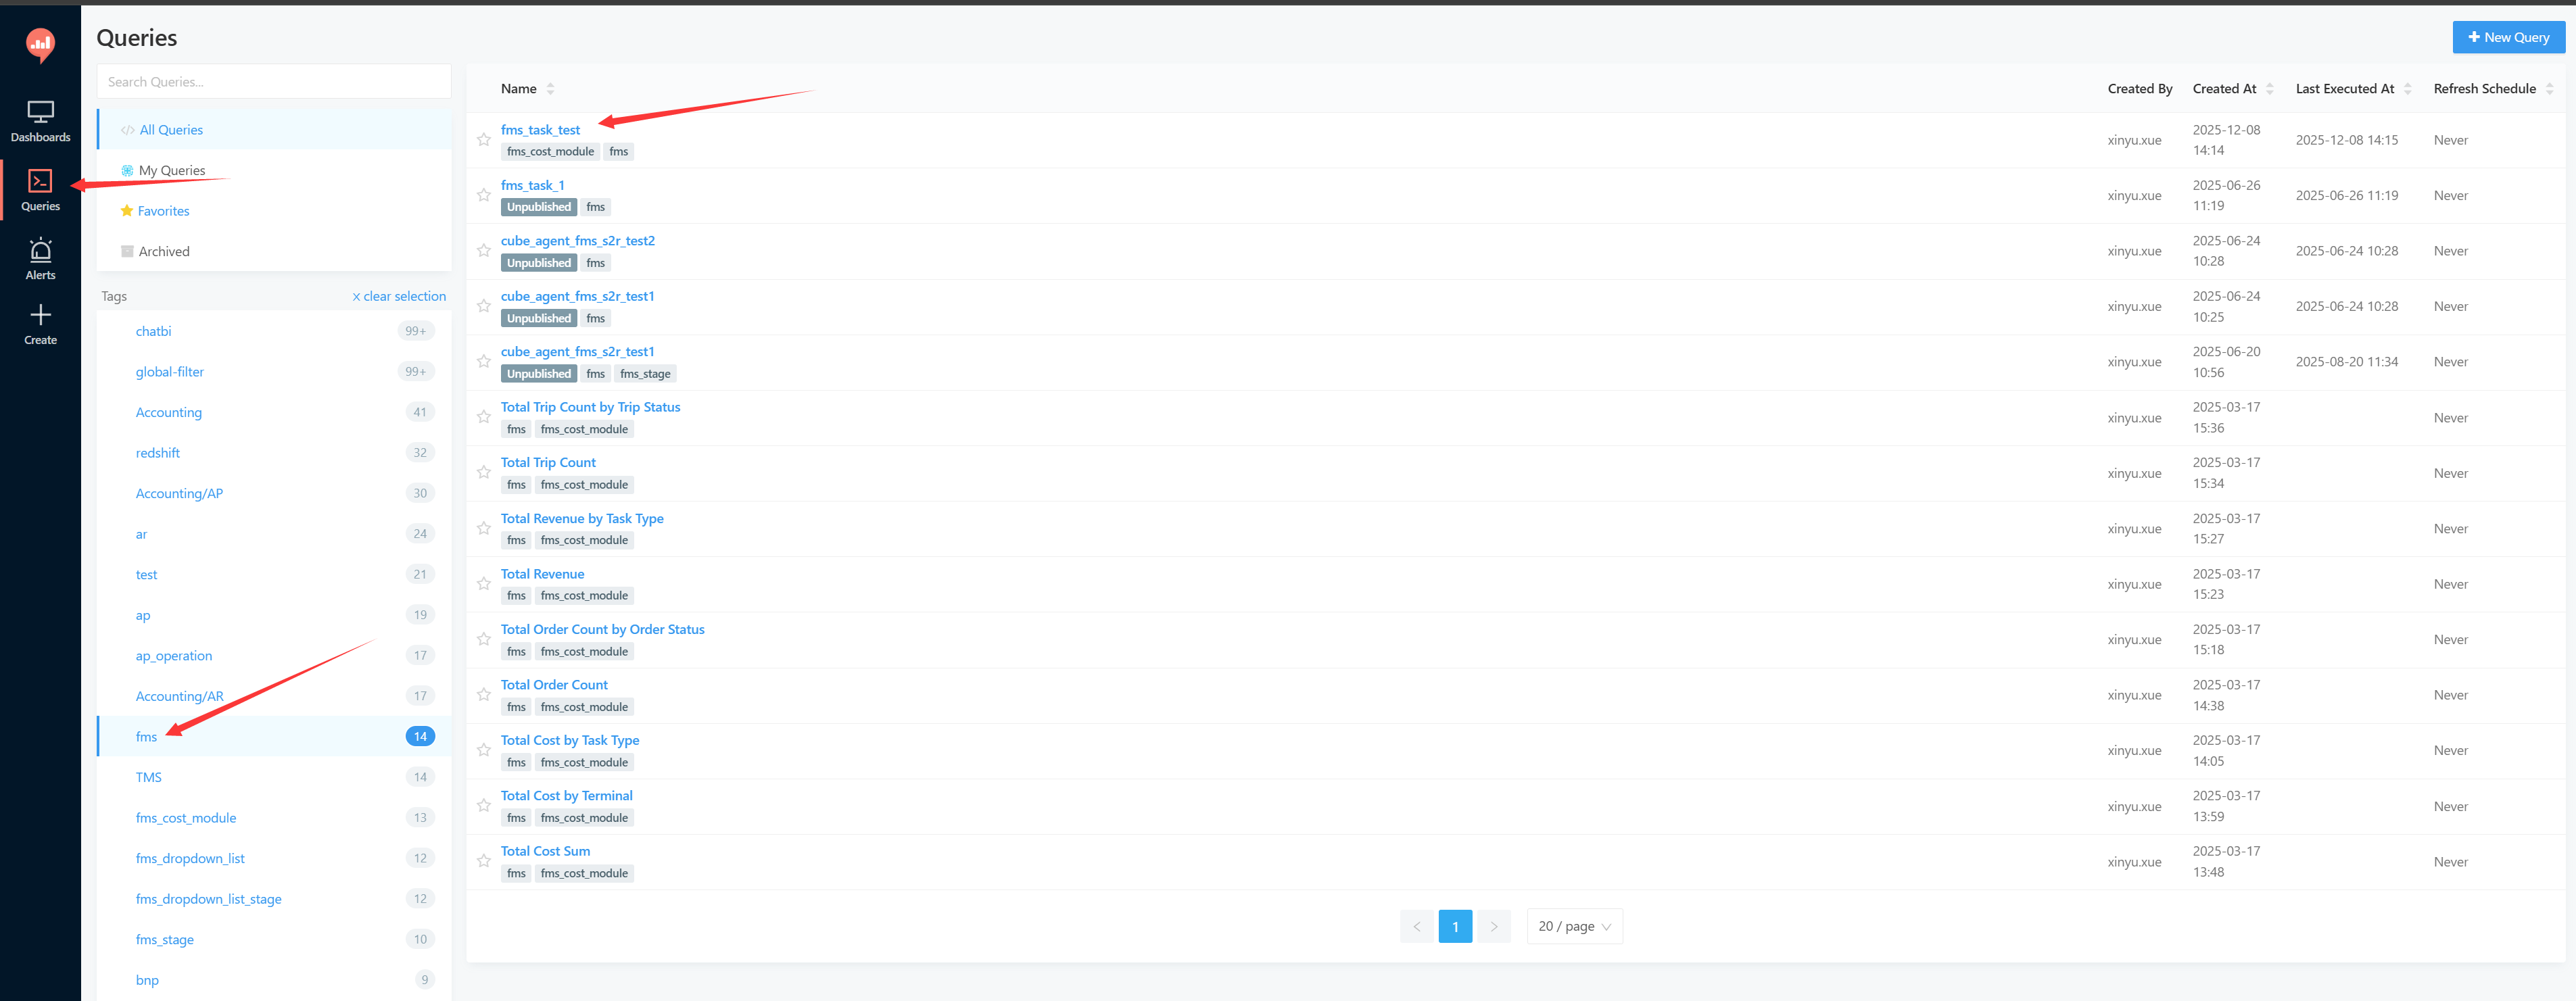
You can see the Query you just created in the Query list
Go to the Dashboard list page and click to create a new Dashboard
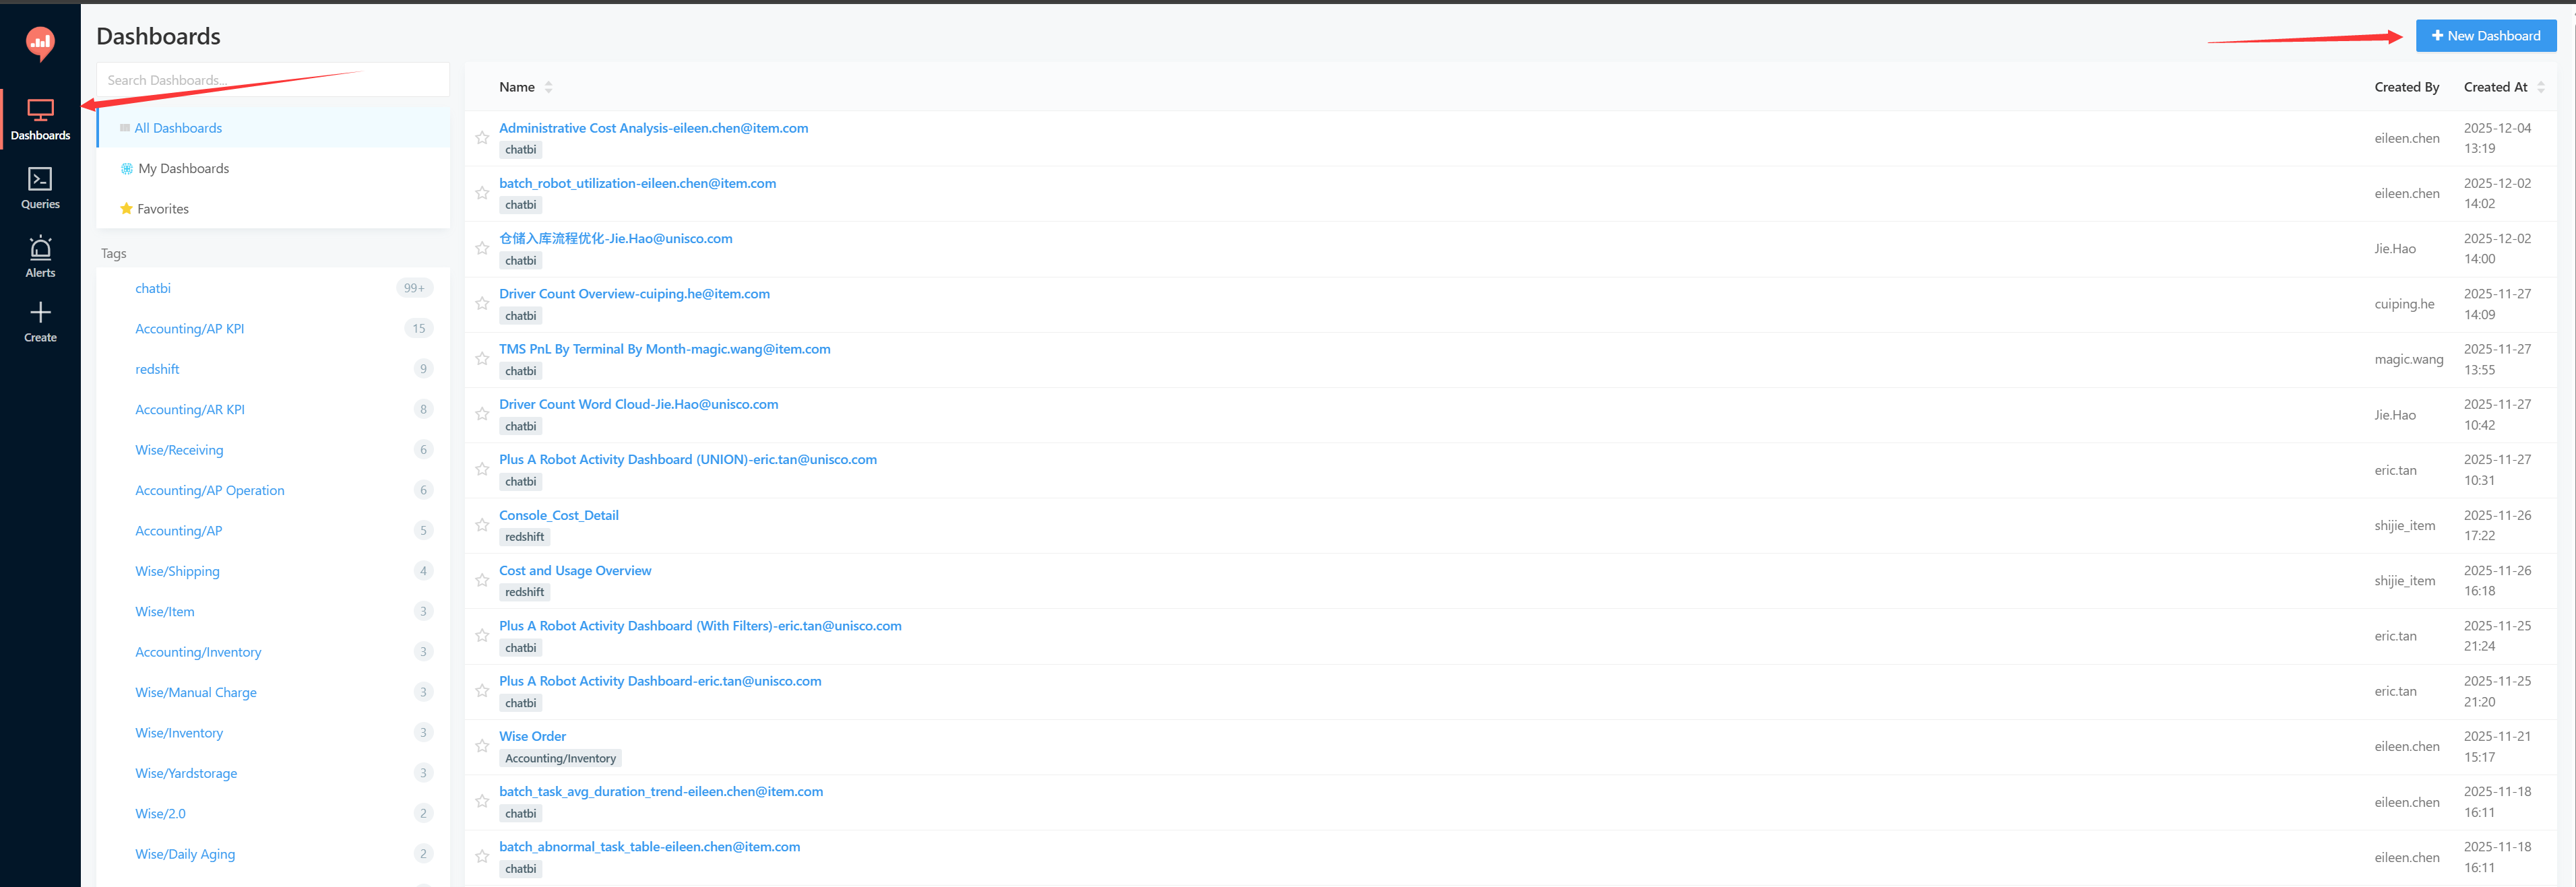
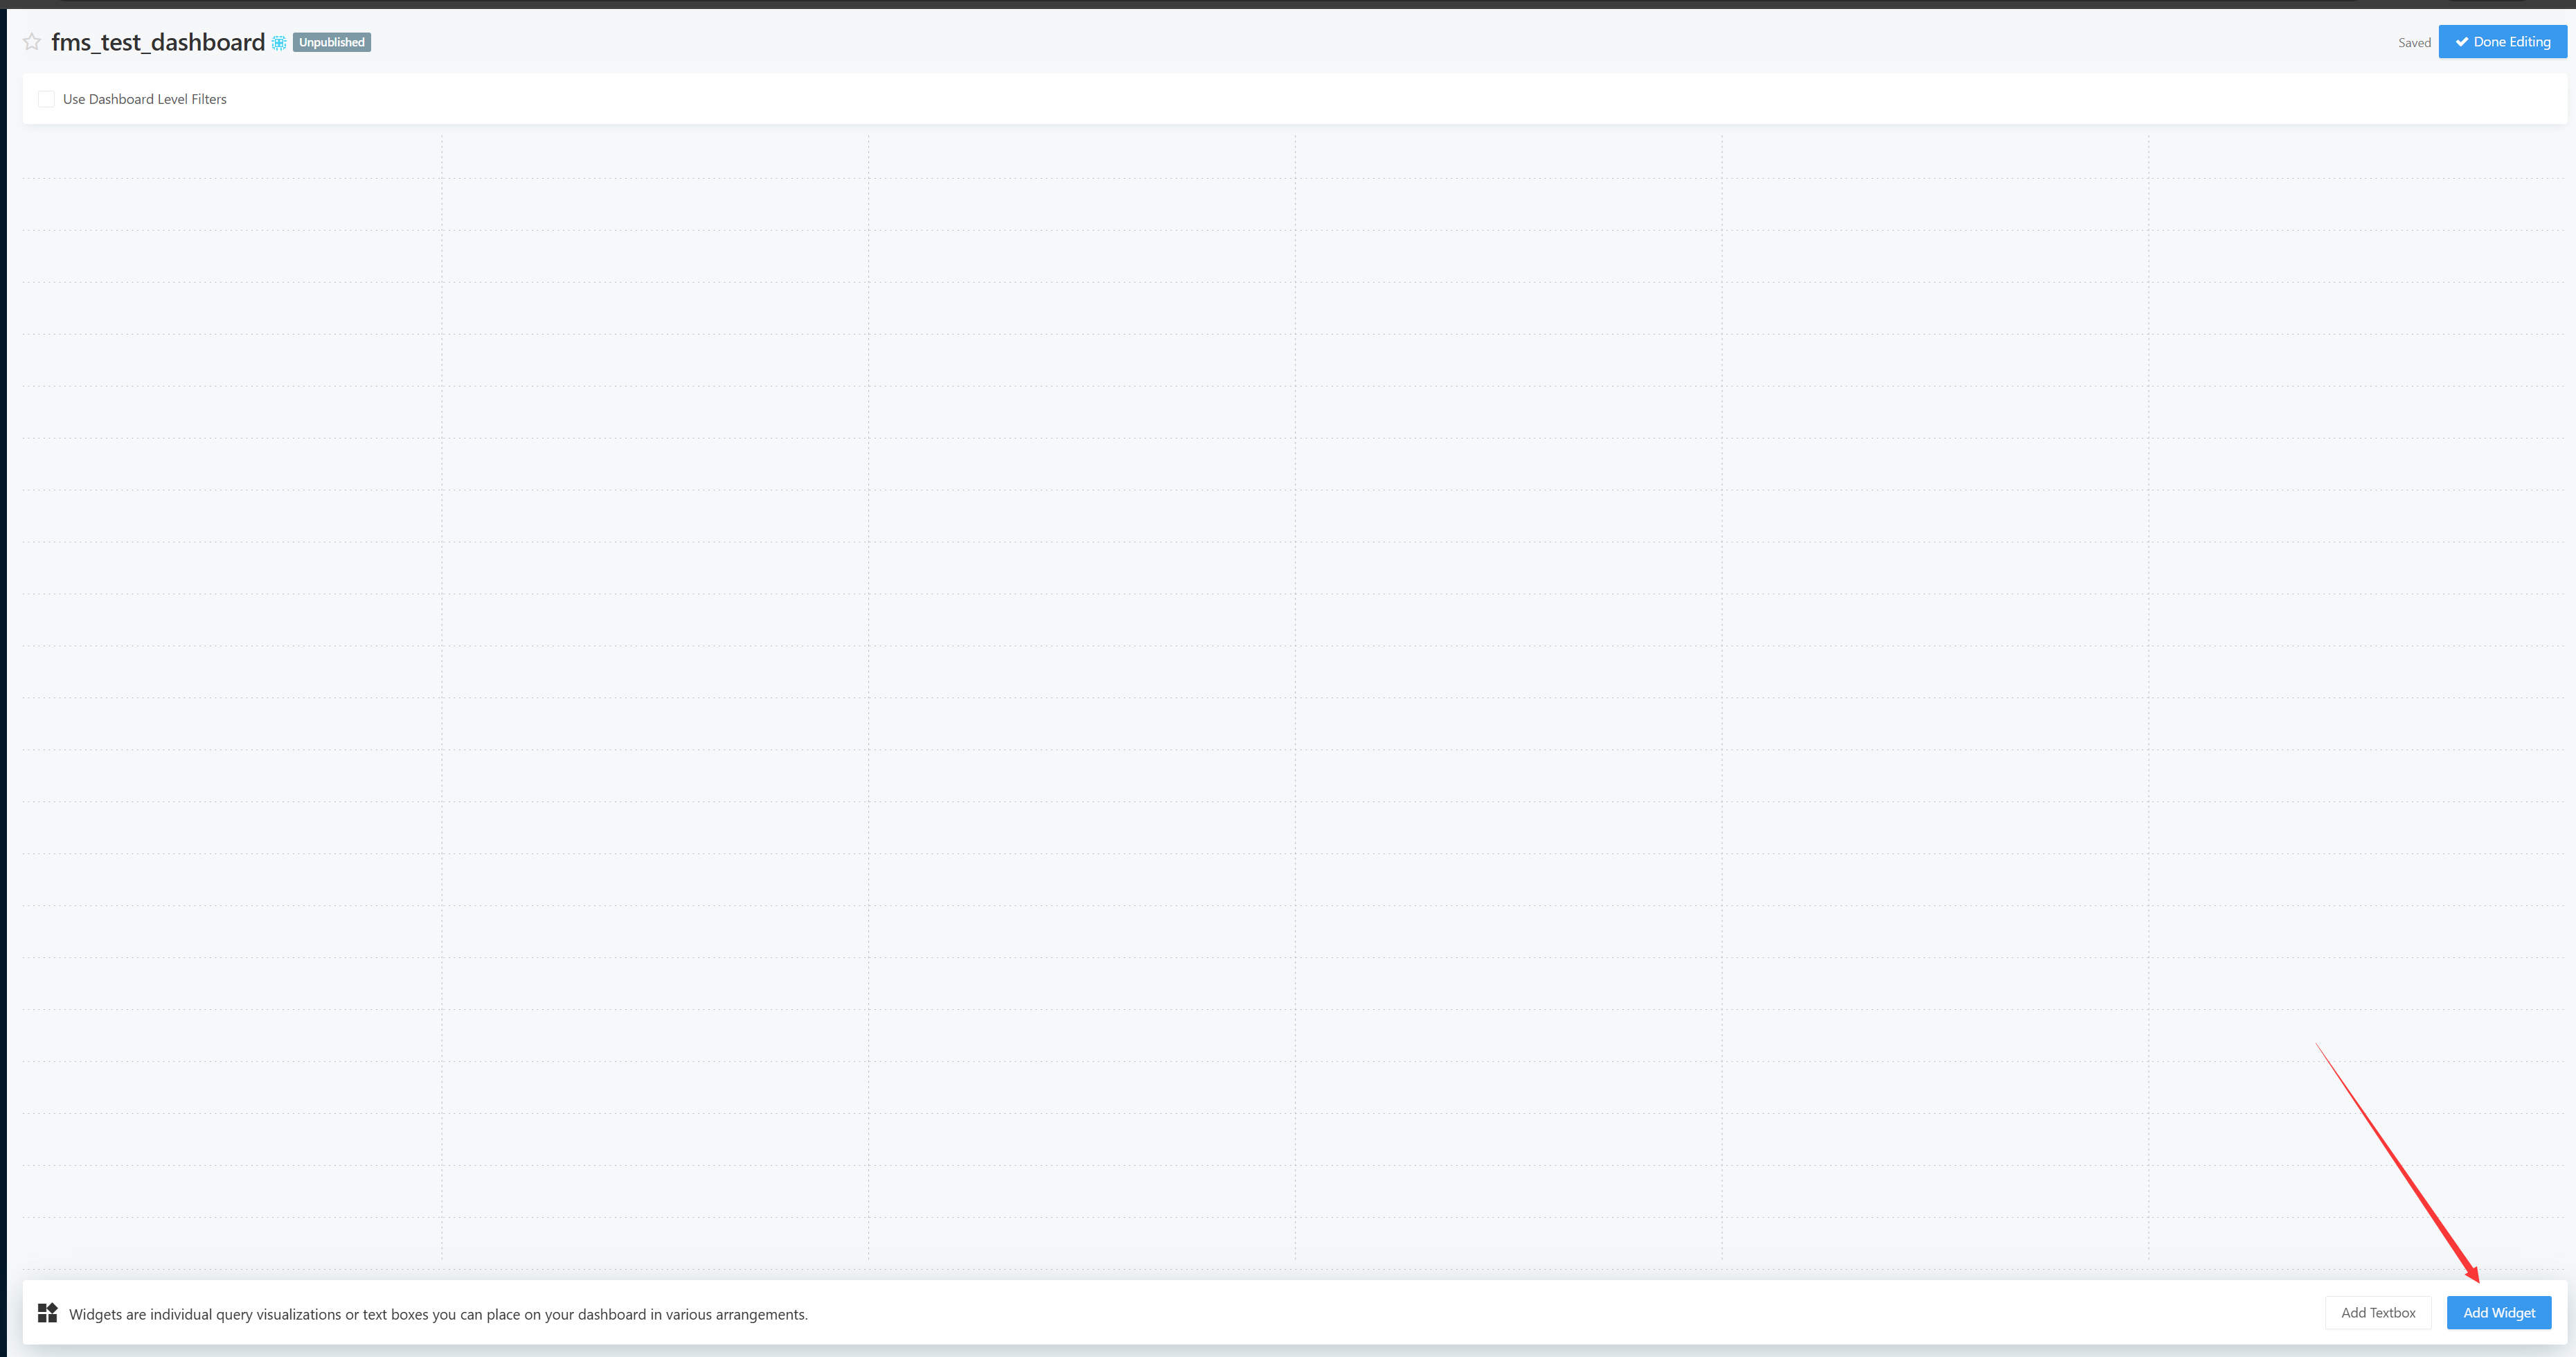
Enter a name and click Save

You will enter a blank Dashboard page. Click Add Widget in the lower right corner to add a Query
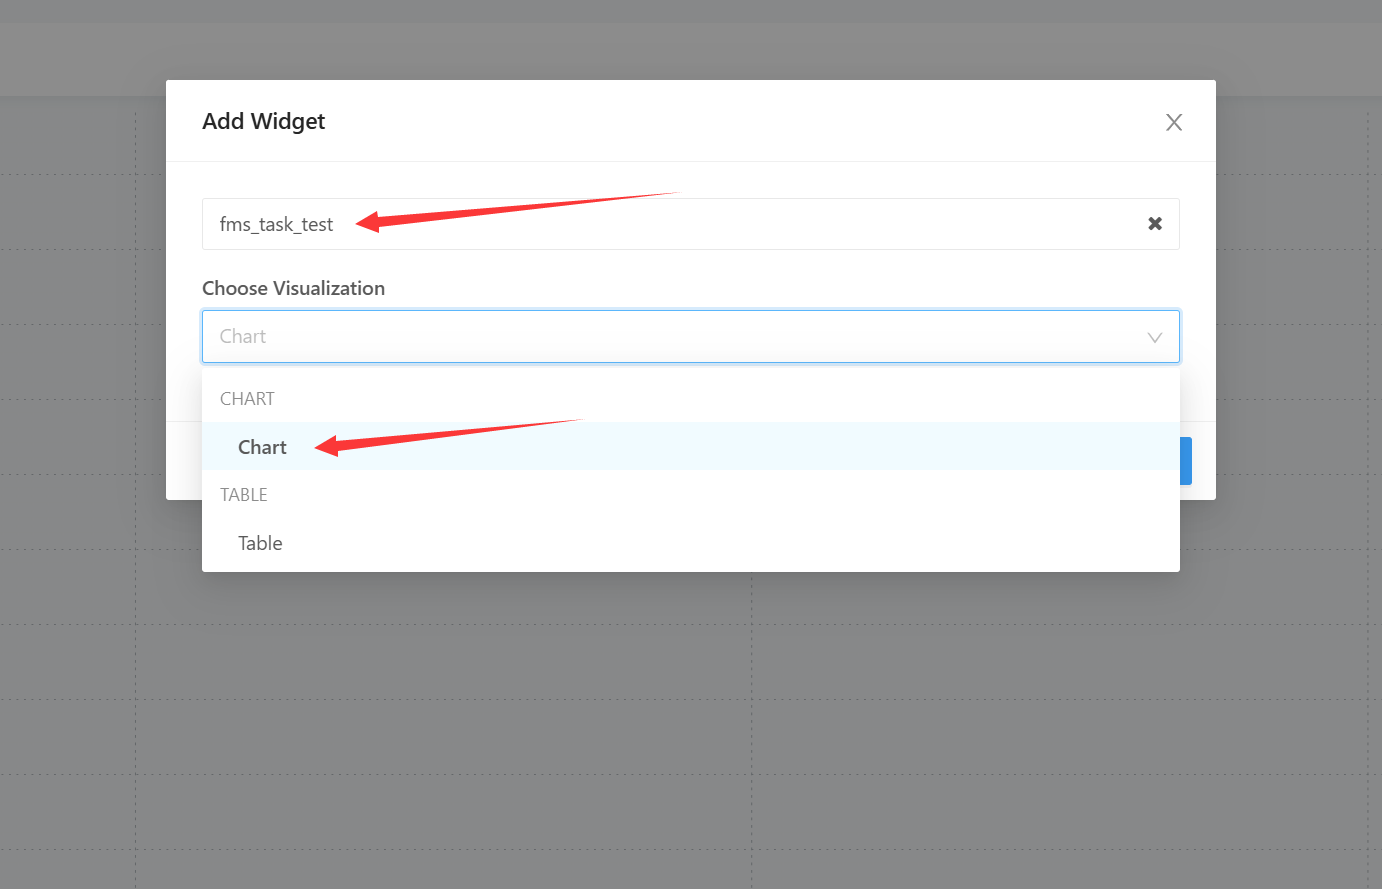
Select the Query you saved earlier, and remember to select Chart for the visualization option below
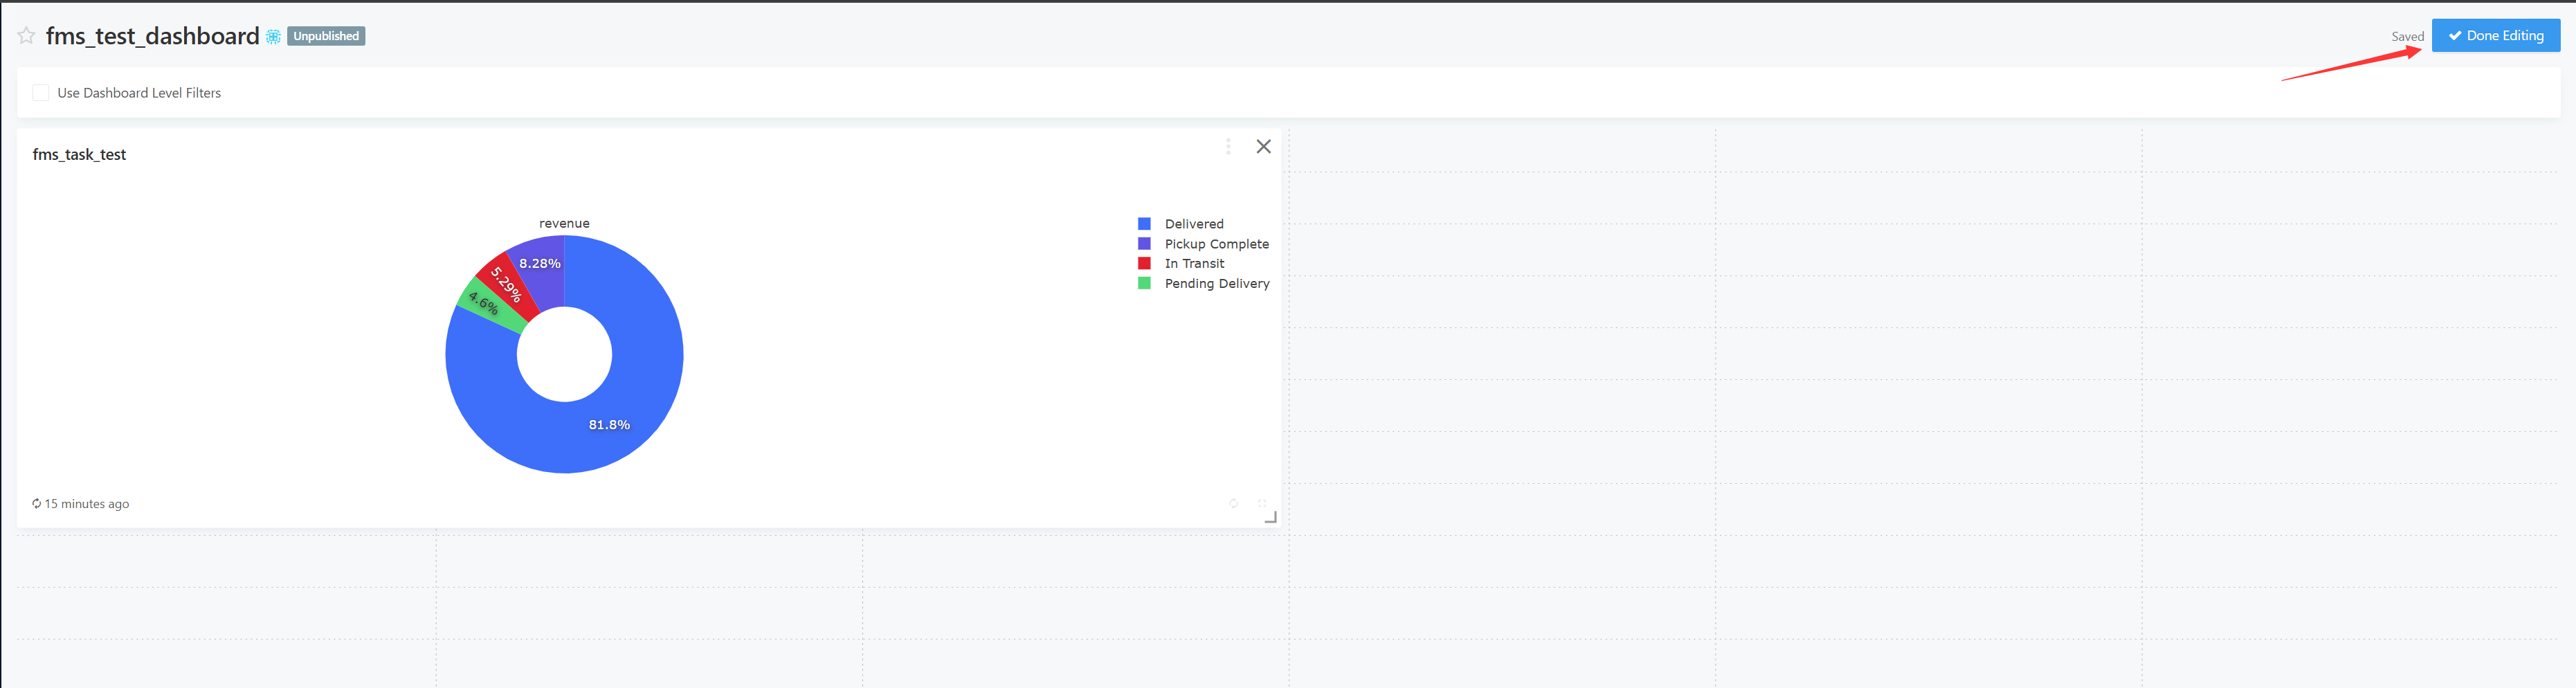
The Query has been successfully added to the Dashboard. You can click Save on the right side
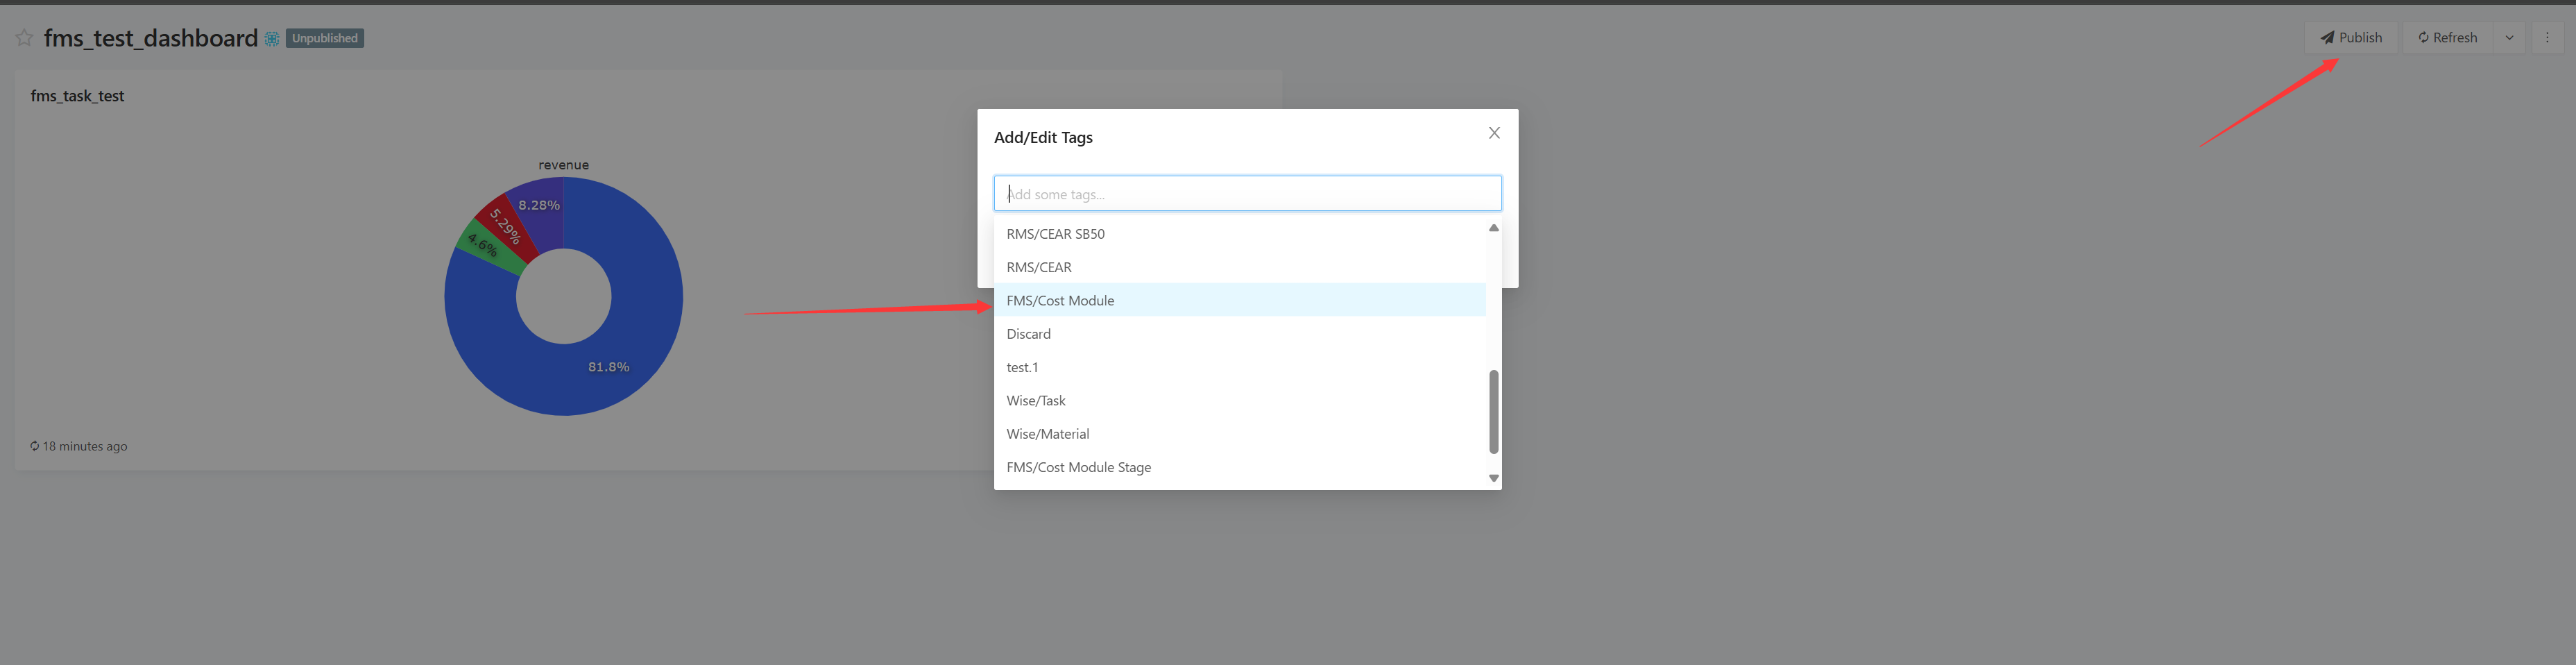
Select appropriate tags and click Publish to complete the Dashboard publication
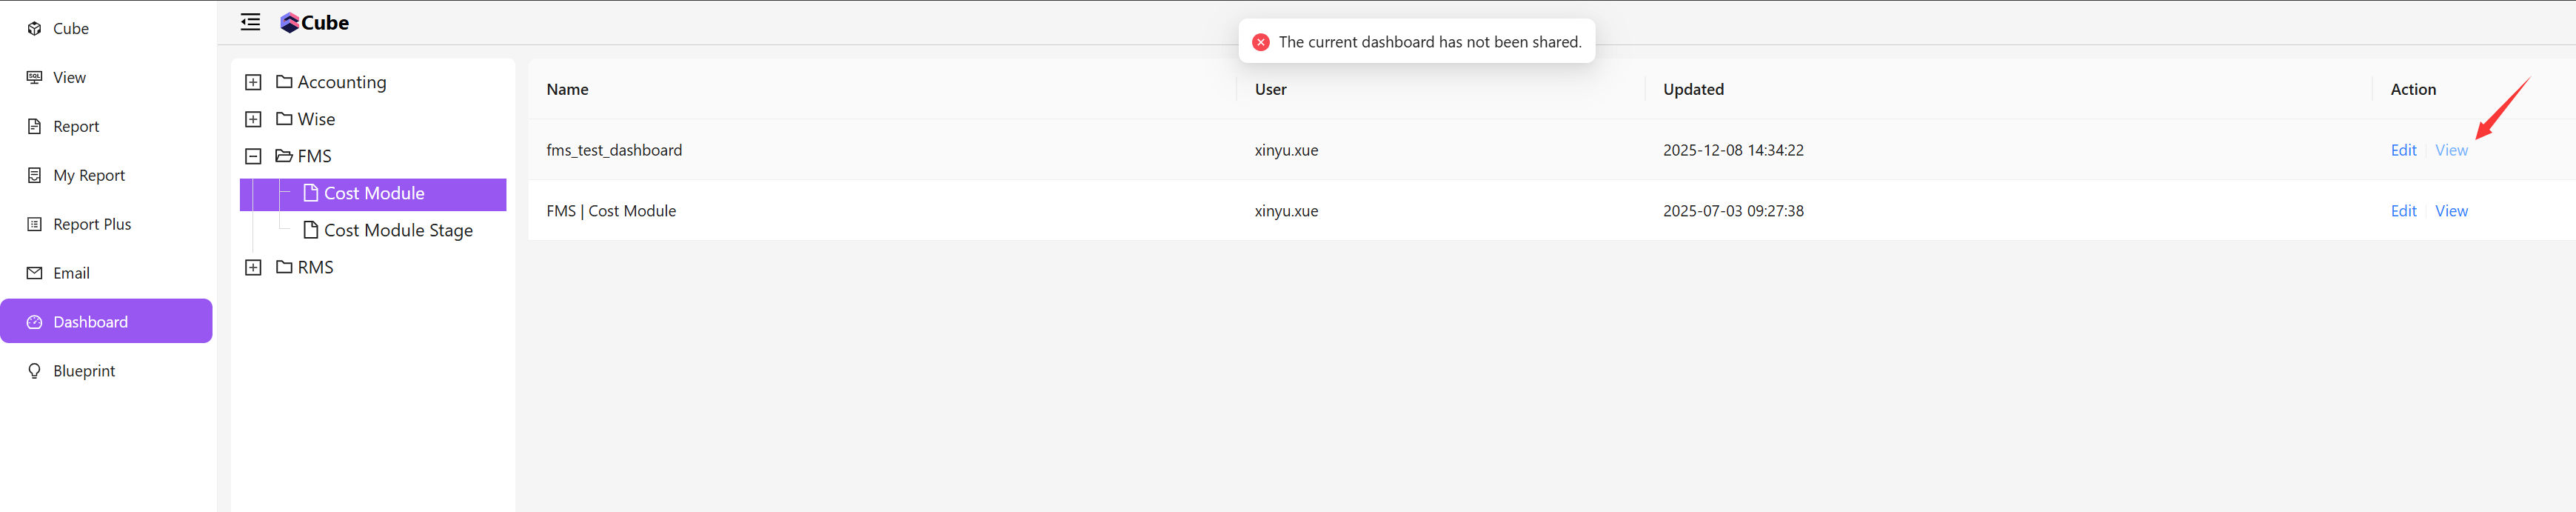
Return to the Cube Dashboard page and select the tag list you just created to view it
Click View, and you will find that you cannot access it. This is because the Dashboard does not have a sharing link and is not yet publicly accessible
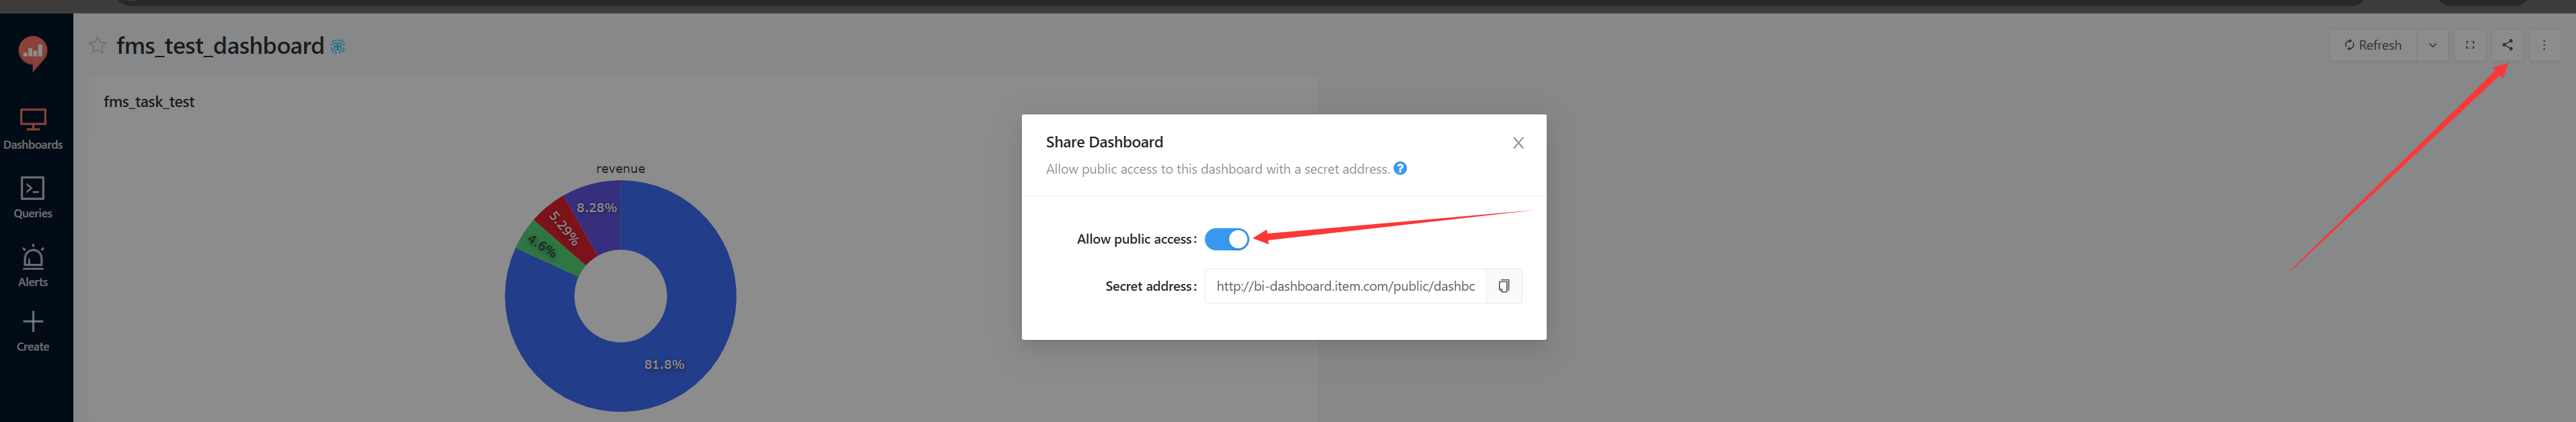
Simply return to the Dashboard page and enable the sharing button
Using Atlas
- Atlas login link
- https://chat.item.com
Click to log in directly. This requires company IAM authentication
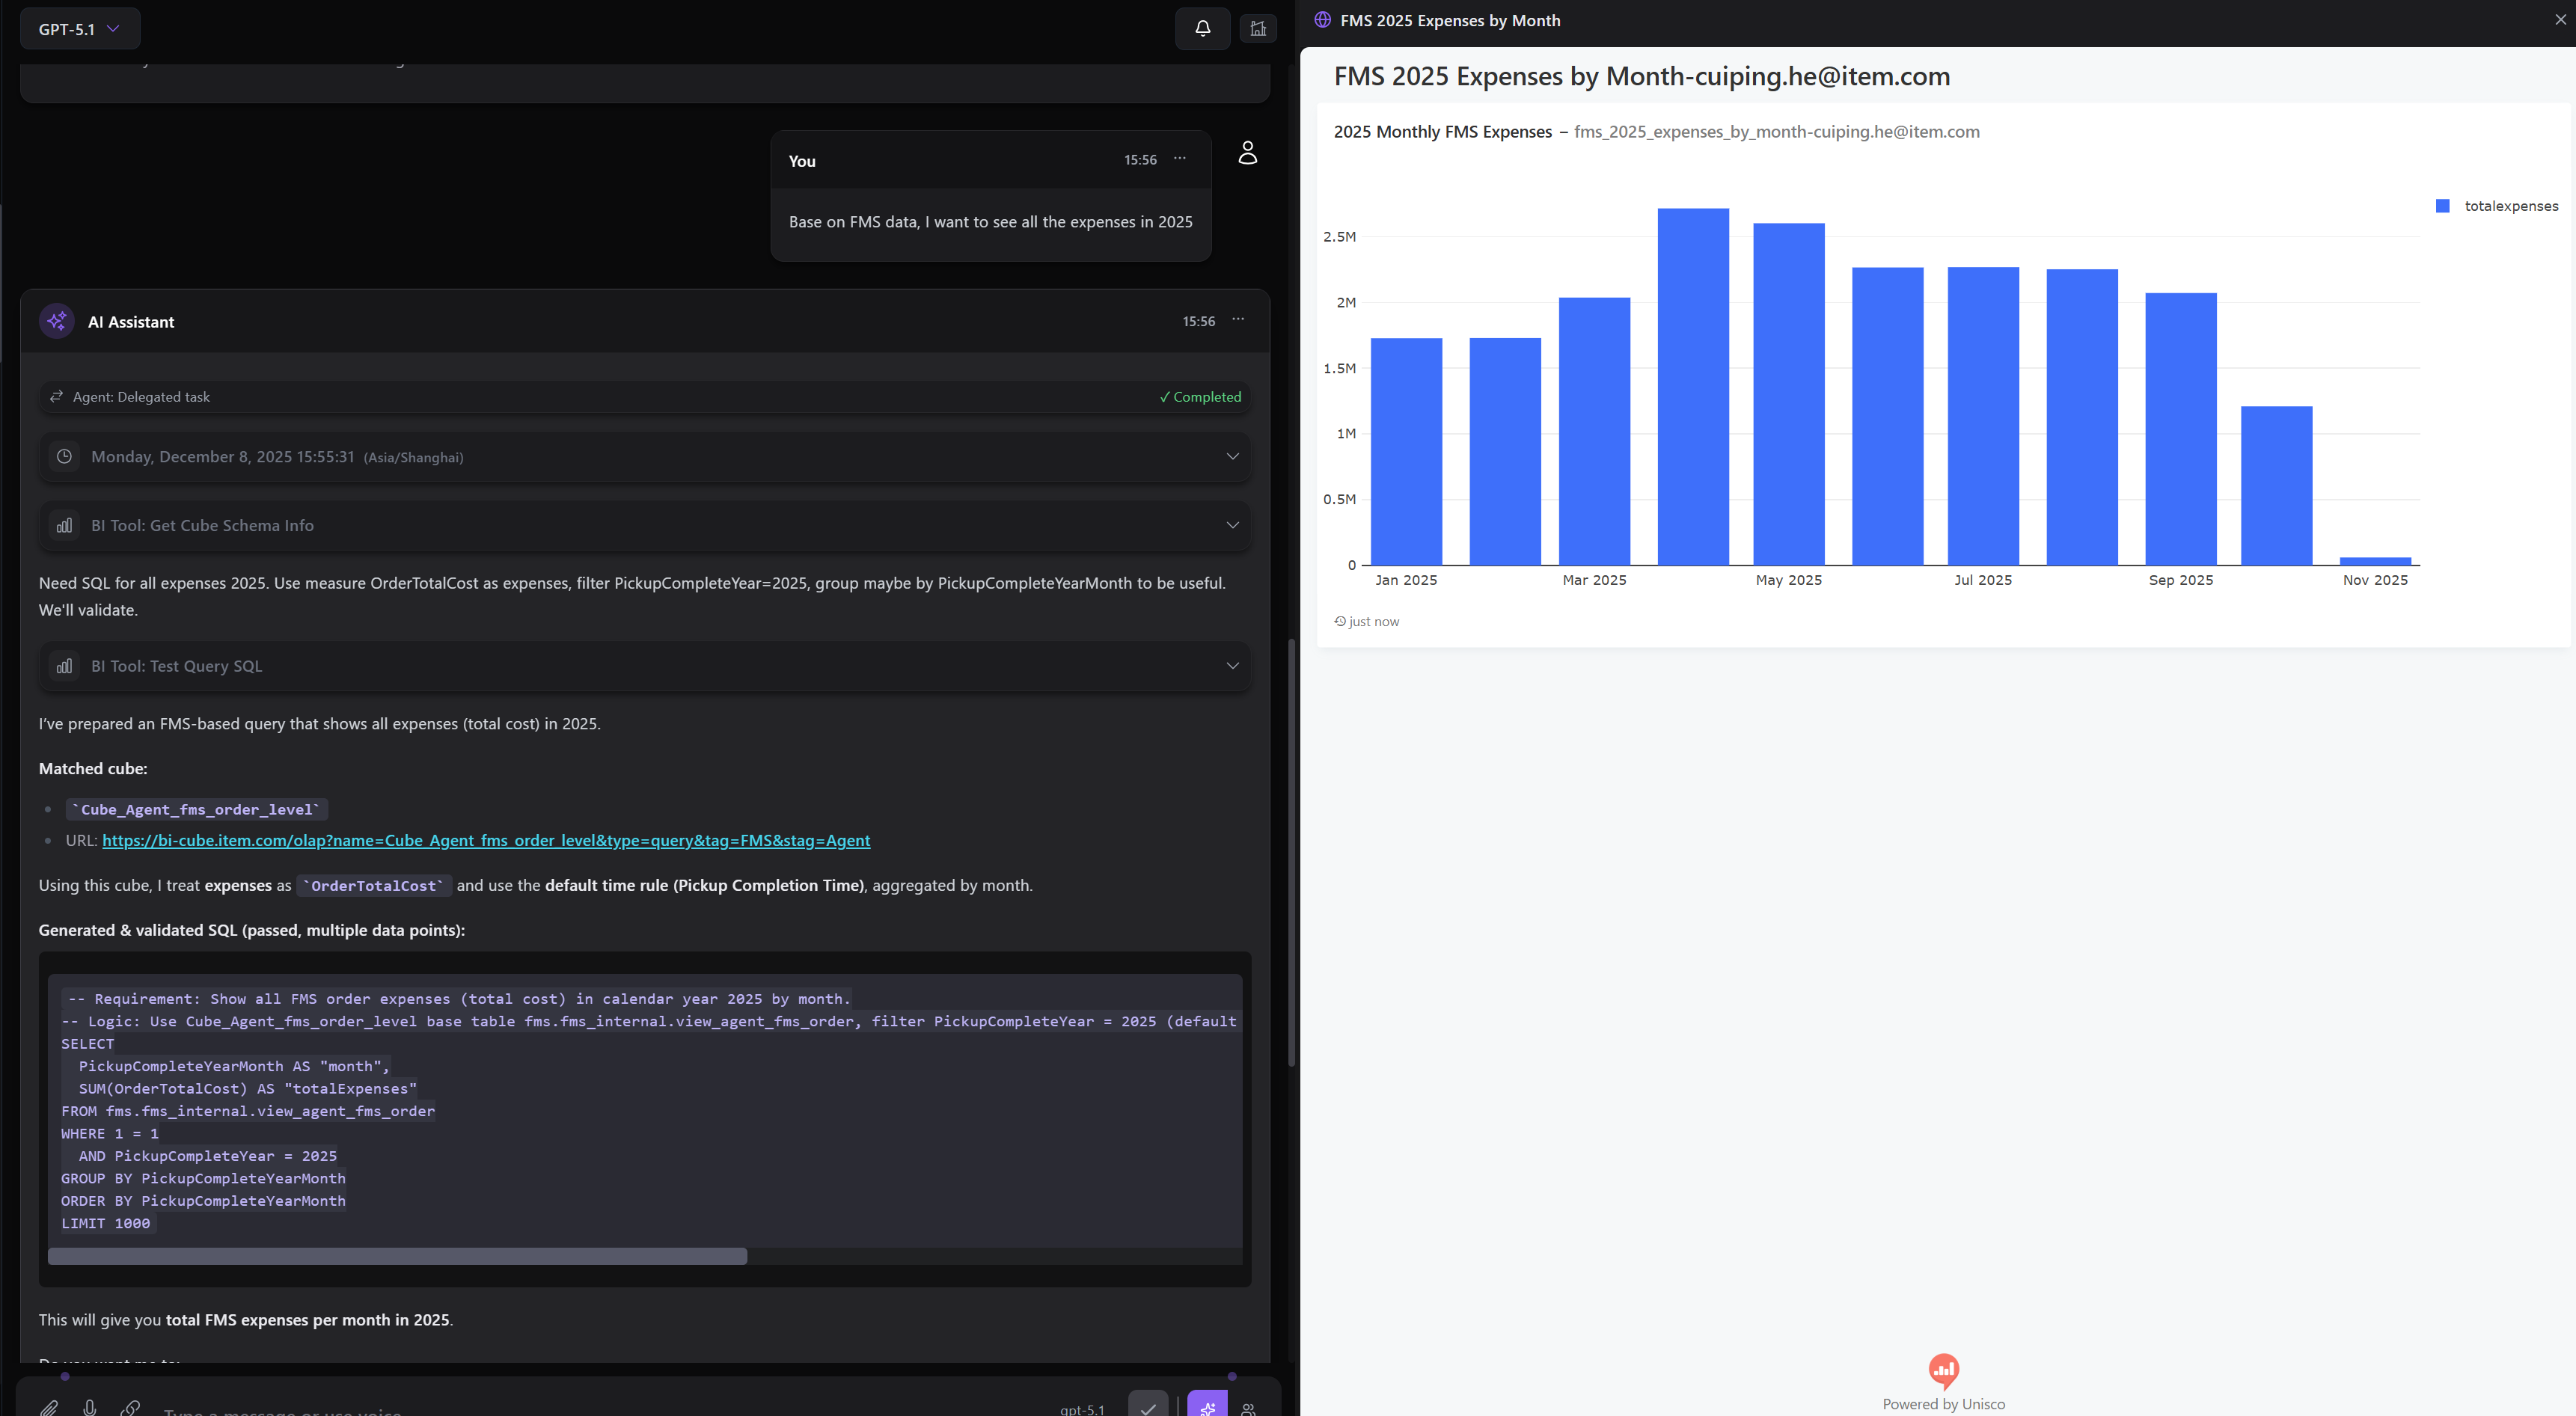
Select the GPT-5.1 model

Enter the business area you are interested in, for example: FMS
I want to see FMS Data Using BI cube
The system will list related cubes

Base on FMS data, I want to see all the expenses in 2025
please create a dashboard
Saving a Copy of the Dashboard
Based on the Dashboard generated in the previous step, you can perform a save-as operation
save a separate version
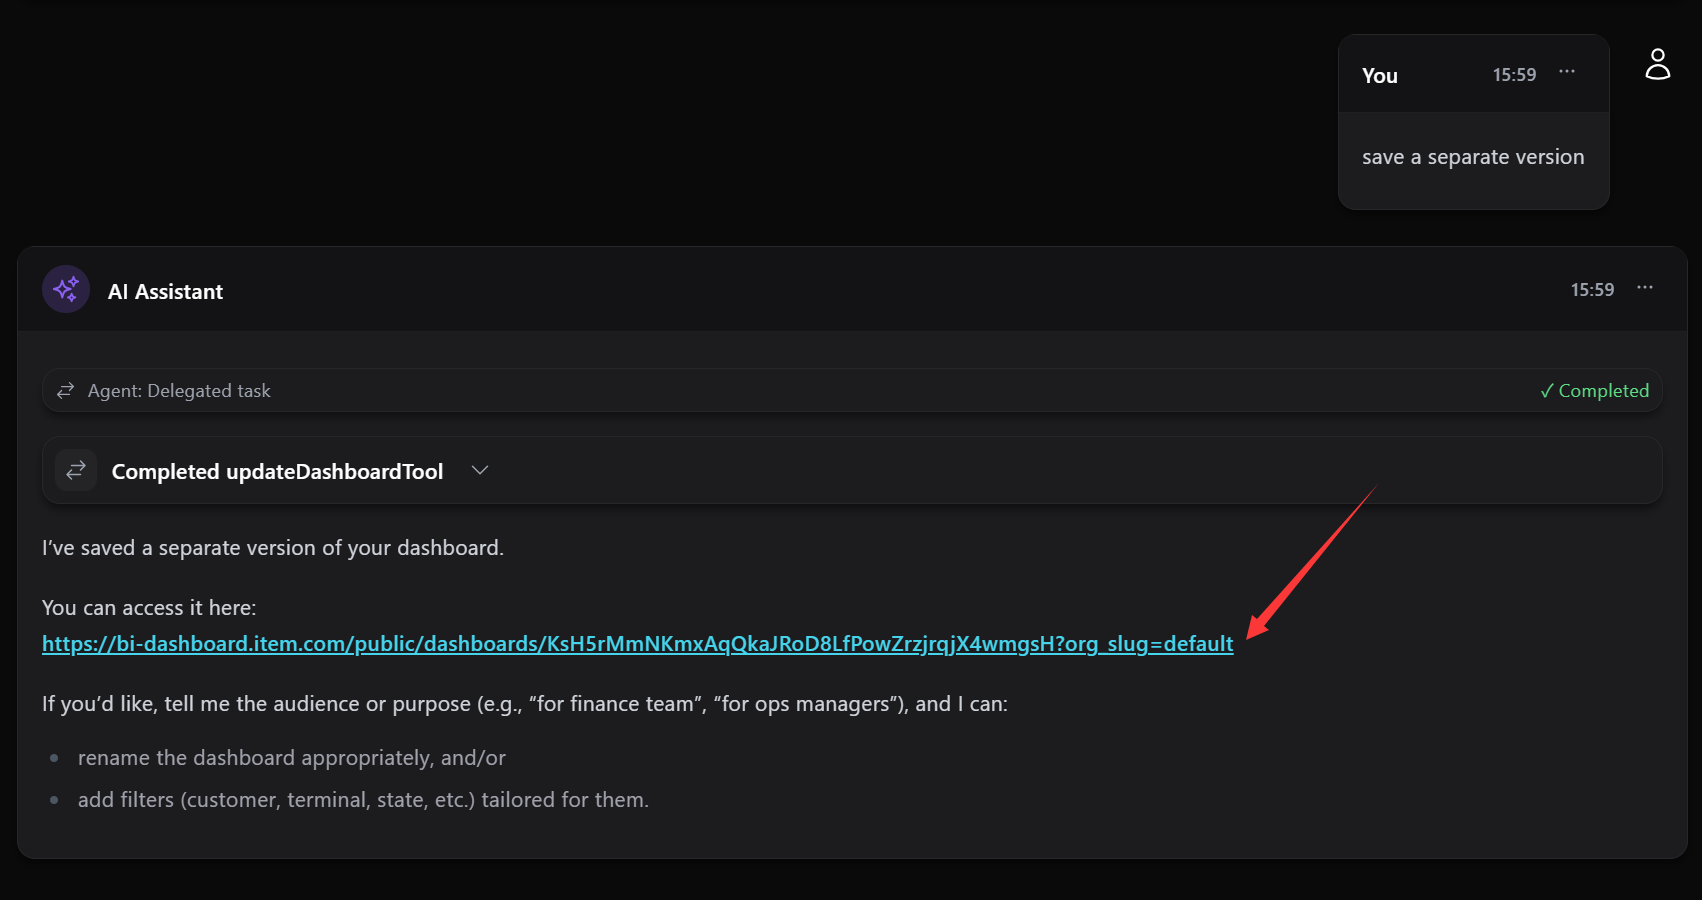
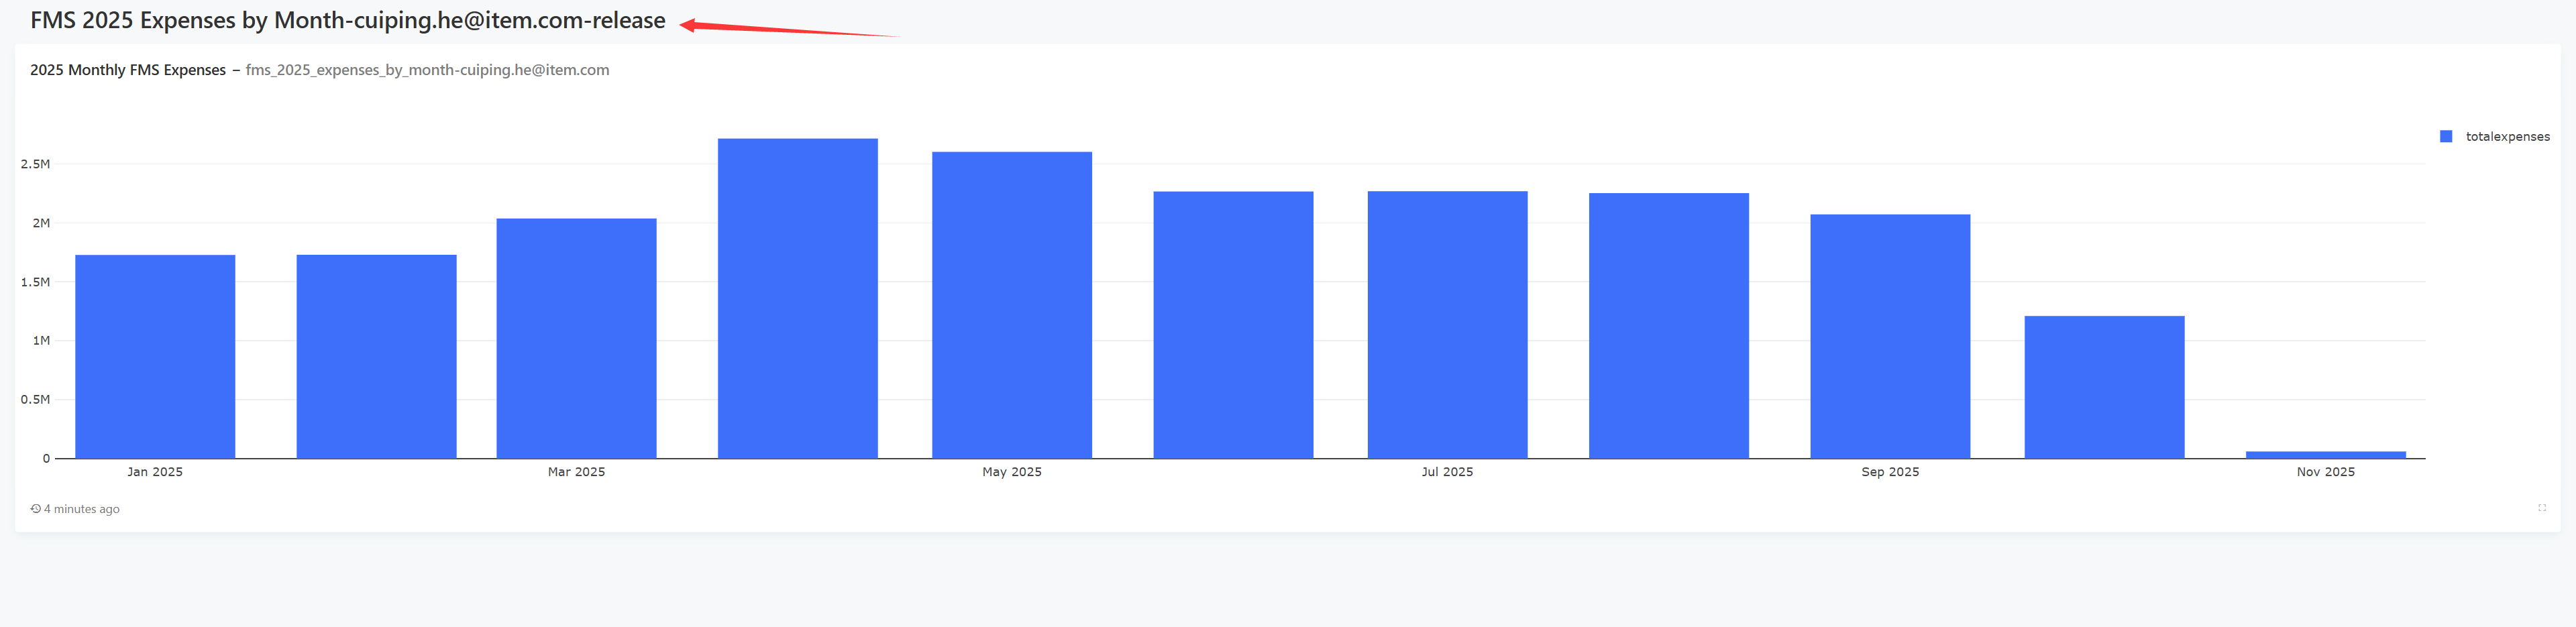
After selecting save-as, click the access link, and you will notice a "release" suffix added to the title
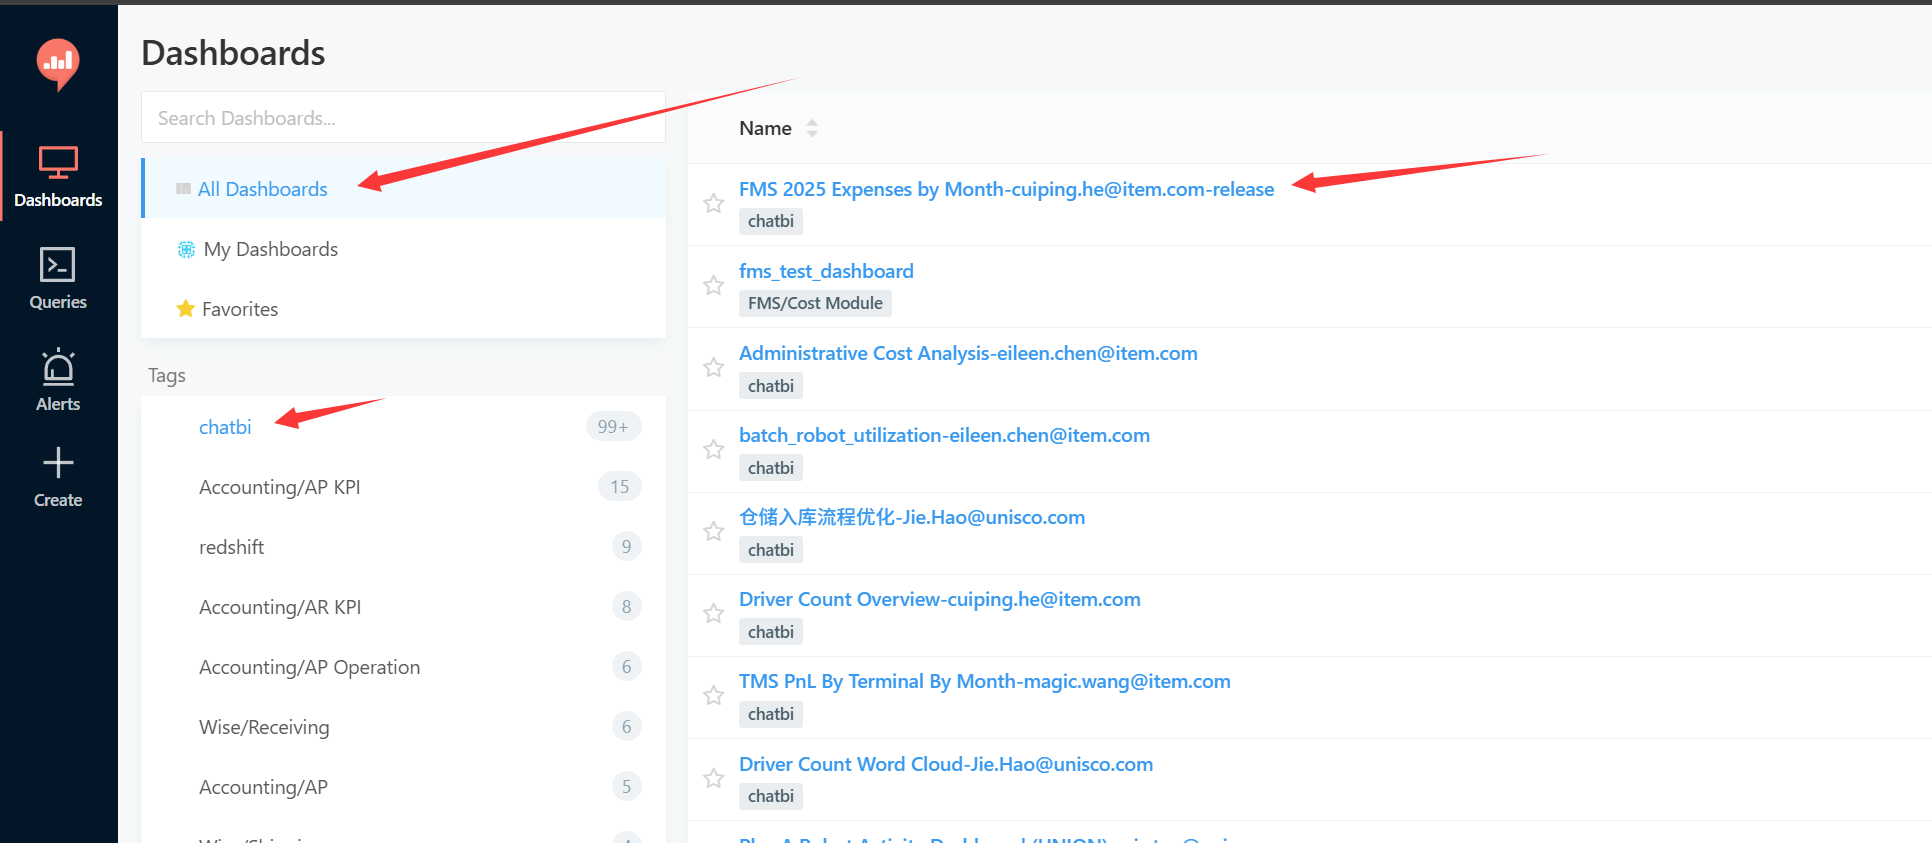
Return to the Dashboard list page mentioned above, and you will see the Dashboard under the chatbi tag. Click to enter and you can also perform edits